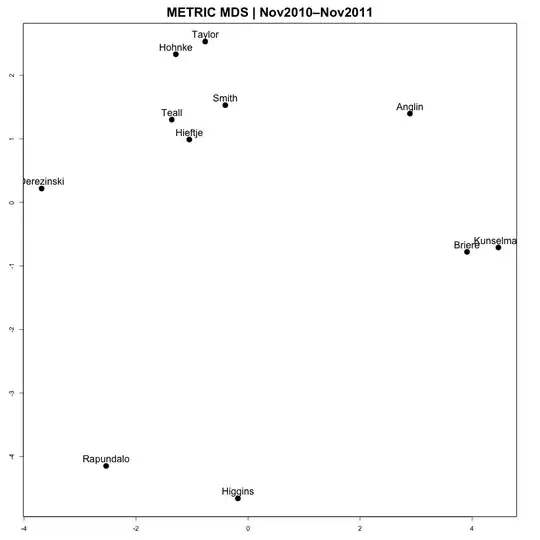
I'm trying to analyze voting patterns of an 11-member city council over a period of five years. Description of data file: each row (vector) is labeled as a councilmember; each column records participation of a councilmember in a particular vote (1 or 0). E.g., each issue on which councilmembers voted will have two columns--one for the yes votes and one for the no votes. If someone was absent, they get zeros for both columns. I didn't include any votes on which the outcome was unanimous.
I've run plots in R by first calculating the distances between councilmembers' vectors and then asking R to do multi-dimensional scaling. These plots square up very well with the intuitions of seasoned council watchers.
So. How do I know if I've got an analysis worth showing the rest of the world? Is 11 a big enough number of councilmembers? Is 100 columns a big enough number of votes? Should I be doing non-metric MDS instead? Are there other questions I should be asking?
This is the template I'm using for these runs in R.
mydata <- read.table("filename.tsv", header=T,     sep="\t",row.names=1)

d <- dist(mydata)
fit <- cmdscale(d,eig=TRUE, k=2)
fit

x <- fit$points[,1]
y <- fit$points[,2]

 png(filename="chartname.png", height=1000, width=1000, bg="white")

par(mar=c(3,3,3,3))

plot(x, y, pch=19, cex=1.8, xlab="Coordinate 1", ylab="Coordinate 2", main="METRIC MDS | Chart Title", cex.main=2)
text(x, y, labels = row.names(mydata), cex=1.5, pos = 3)

box()

dev.off()
