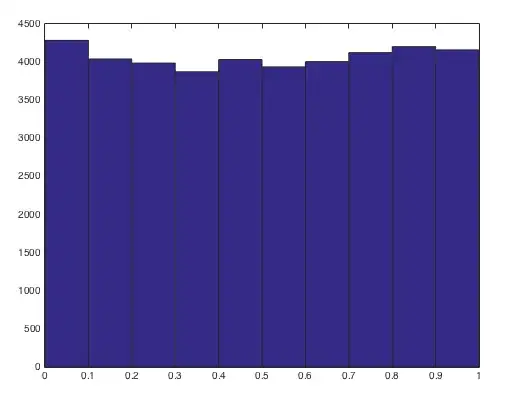
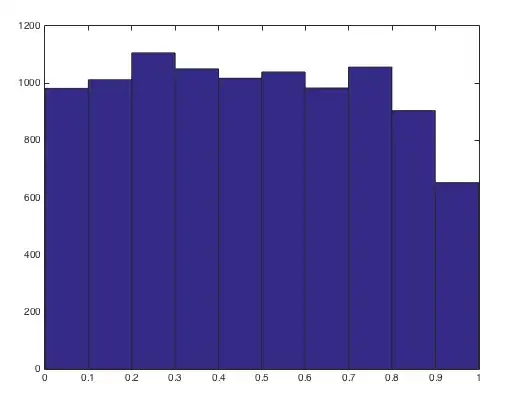
I have two histograms shown below.

As you can see, the two histograms are different in appearance. However, when I calculate the mean of the two histograms, they are pretty similar. The mean for the top graph is close to 0.500 and the Mean for the bottom graph is 0.478. I'm trying to figure out a way to capture this difference in some sort of measurement. The mean is obviously not too descriptive of the data. Is there any way to calculate a measurement that will more closely depict the difference in the two histograms data?
I'm sorry if this post is confusing. I'm having trouble wording me question. I had someone suggest to do a distance from middle measurement, but when I tried to look up what that entailed, I couldn't find anything.
