In linear regression, is the $R^2$ value enough to assess whether the relationship between the independent and dependent variable is linear? It gives the amount of variability in the dependent variable explained by the independent variable. I know that you can plot residuals versus the x value or residuals versus the y value and see if there is a pattern (if there is a pattern then the relationship is not linear). But doesn't the correlation coefficient give enough information about linearity?
Asked
Active
Viewed 1,376 times
3 Answers
14
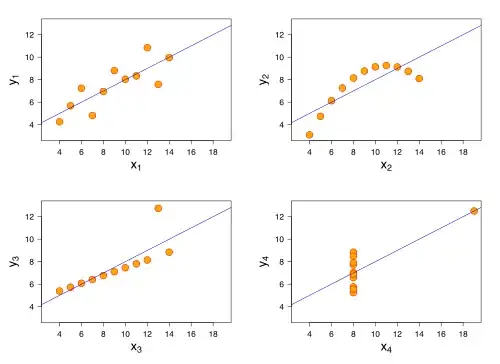
If you look at Anscombe's quartet you can see examples of linear with noise, linear with outliers and non-linear sets of data with the same $r^2$, means and variances.
This image is from the Wikipedia article
Henry
- 30,848
- 1
- 63
- 107
-
1+1 To be contrary or irksome, one might argue that in some sense the last three are all "equally" non-linear, but the contrast with the first one (which is a classic linear scatterplot) speaks volumes. – whuber Oct 04 '11 at 23:09
6
Usually not. The model
$$y_i = \beta + \varepsilon_i,$$
$\varepsilon \sim \text{iid}$, $\mathbb{E}[\varepsilon]=0$ for the relation between $(y_i)$ and $(x_i)$ is perfectly linear, yet has an $r^2$ of zero.
For other examples of what $r^2$ does not say about linearity, see the illustrations in my reply at Is $R^2$ useful or dangerous?.
Linearity is generally assessed by goodness of fit testing; for instance, by including additional terms in a follow-on regression and testing whether they are both significant and important in the application. One person's nonlinearity is just another person's randomness, so there's no omnibus method. Nevertheless, usually $r^2$ is just too crude.
-
-
-
If there is a pattern in the residuals vs fit plot.....then there is nonlinearity? – question Oct 04 '11 at 22:14
-
@question If it (a) is a pattern in which the *mean* residual varies and (b) it would be unacceptable to treat that pattern as random, then--practically by definition--there is nonlinearity. Some patterns do *not* indicate lack of linearity but suggest other phenomena such as heteroscedasticity, outliers, or high-leverage points, so we shouldn't assume *all* deviations from randomness are evidence of nonlinearity. – whuber Oct 04 '11 at 22:16
4
In addition to the above answers, a commonly used (in econometrics) test for general regression nonlinearity is Ramsey's RESET test. Suppose you ran your main regression and obtained residuals $\hat\epsilon_i$ and fitted values $\hat y_i$ in it. Then RESET test is the test of the overall significance in an auxiliary regression of $\hat\epsilon_i$ on powers of $\hat y_i$. From regression geometry, we already know that $\hat\epsilon_i$ are orthogonal to the zeroth and the first power of $\hat y_i$, so it makes sense to run it as $\hat\epsilon_i \sim \hat y_i^2 + \hat y_i^3 + \ldots$, in R-like pseudocode. The test is implemented in R as resettest in lmtest package, and in Stata, as estat ovtest after regress.