0

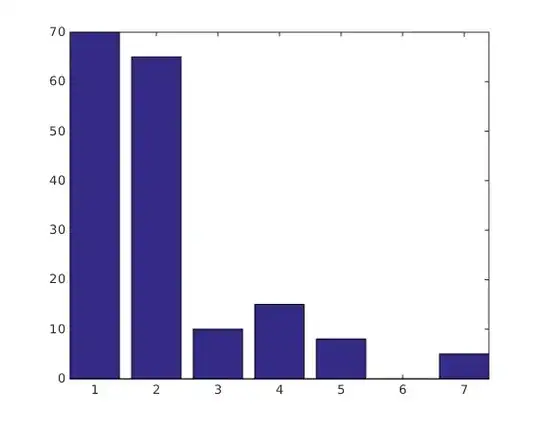
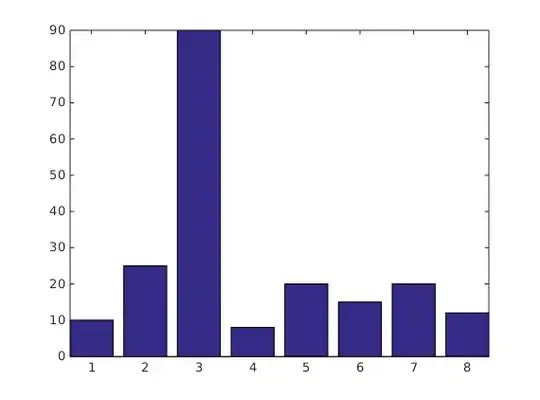
I have a bunch of histogram distributions. In some of the histograms (let's call these Type-A), the initial 2-3 bins are extremely tall compared to the remaining bins. In others, there is no discernible pattern (let's call these Type-B). I would like to differentiate between Type-A and Type-B distributions. Now, Type-A seems like the opposite of heavy-tailed distribution (heavy-headed ?). Is there a way to characterize such distributions ?

Ideally, I would like to accomplish this in such a way that the differentiating measure (between Type-A and Type-B) holds for a reasonable range of histogram bin sizes.

Examples:

Type-A:

Type-A

Type-B:

Type-B

curryage
  • 263
  • 3
  • 10
  • 1
    It sounds more like "heavily right skewed" vs I-can't-guess-what ... can you show examples? – Glen_b Jul 30 '15 at 04:42
  • On the "range of histogram bin-sizes" thing -- you can't always get consistence from histograms. Even changing bin-origin can lead to [dramatic changes](http://stats.stackexchange.com/questions/51718/assessing-approximate-distribution-of-data-based-on-a-histogram/51753#51753) in some cases – Glen_b Jul 30 '15 at 04:47
  • @Glen_b Added examples ... – curryage Jul 30 '15 at 05:01
  • 1
    What you have drawn there is a bar chart, not a histogram. Are these Likert-scale items? – Glen_b Jul 30 '15 at 06:10
  • @Glen_b The x-axis corresponds to item categories and the histogram measures their frequency. These are not Likert-scale items. – curryage Jul 30 '15 at 08:08
  • 1
    Do these item categories have some kind of order with an inherent meaning, or are the numbers "1" through "8" merely convenient labels for them? – whuber Jul 30 '15 at 13:36
  • @whuber They do have an order. – curryage Jul 30 '15 at 16:24

0 Answers0