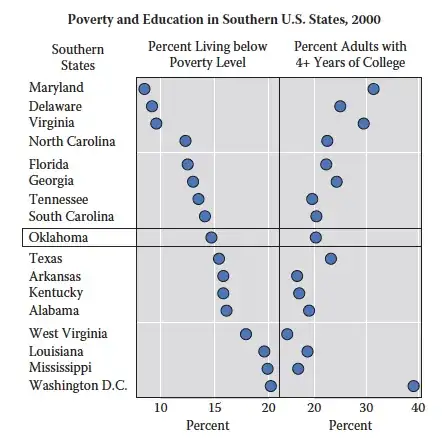
I have 20 correlation coefficients (r) to report, for example, .34, .45, .67, .23. and so on. These are correlations between Variable A and Variable B, based on gender, age, education levels etc.
I am after a succient method to show all the correlations in one glance. Is there any best practice in regard to reporting all these correlations in a table format?
