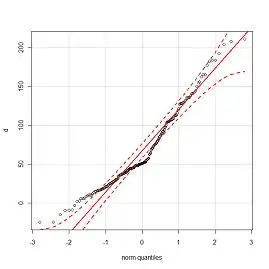
I'm trying to figure this out myself, but from my stats training, if your qqplot points fall within the confidence interval bounds, then the data are fairly Normal (this is what you want for linear models, such as linear regression or ANOVA).
$H_0:$ Data is Normal vs $H_A:$ Data is not Normal
You want to fail to reject the null hypothesis.
However, if your qqplot points are really not mostly within the CI, then your data is not Normal. You may want to then consider nonparametric methods.
The plot above looks fairly Normal; problems at the tails, so you may want to look out for outliers. Real world data is never perfect.
If I come across a solution for methods of CI construction, I'll edit this post.