2

I'm doing a project about dilated kidneys, these can be arranged into mild, moderate and severe. There are 53 patients in total. I want to see if there is a trend in the severity of dilatation between those that have an 'adverse outcome' (like surgery, scarring etc) and those who do not.

Here is my data:

              mild(1)       mod(2)     severe(3)       Total

Adverse outcome ---0---------------- 4-----------------5--------------------9

No adverse outcome-28--------------10---------------- 6------------------ 44

Total----------------------28--------------14---------------11----------------- 53

Now, i realise these numbers are fairly small. I am new to statistics and initially tried a chi-square test for linear trend using software which came out as P=0.0003. However on reflection, the data values in some of the boxes are very low (and one is zero!) - do the same minimum values apply for chi-square for linear trend as with pearsons chi-square? ie 80% expected values should be above or equal to 5. Nothing online seems to mention any particular threshold for chi-squared for trend.

If i cannot use this test, please could you let me know of an alternative ASAP? thanks a lot!
nicole
  • 21
  • 1
  • It's worth noting that the guidelines surrounding minimum values you mention refer to the expected values in the cell, not the observed values. – Marcus Morrisey Mar 29 '17 at 14:47

1 Answers1

2

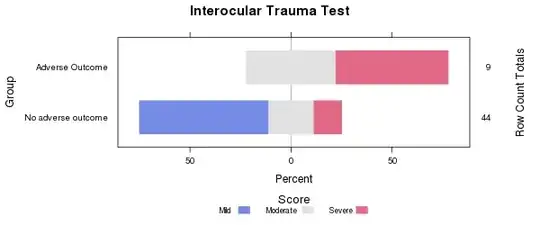
For your data, I would use the IOT (Interocular Trauma Test – the results are obviously statistically significant):

Graphical representation of the data

But in general, if you want a proper statistical test, I recommend the Wilcoxon–Mann–Whitney test. It’s based on the following idea: If you choose a random ‘adverse outcome patient’ and a random ‘non-adverse outcome’ patient, what’s the probability that that the ‘adverse’ patient will have the most severe dilatation. The null hypothesis is that this probability is 50%.

Here’s some R code to perform the (two-sided version of the) test:

> adv = rep(1:3, times=c(0,4,5))
> no_adv = rep(1:3, times=c(28,10,6))
> 
> library(exactRankTests)
> wilcox.exact(adv, no_adv)

    Exact Wilcoxon rank sum test

data:  adv and no_adv
W = 337, p-value = 0.0001798
alternative hypothesis: true mu is not equal to 0

Since you have lots of ‘ties’, I used the exact version of the test.

But really, you have so much data, at least in one of the groups, that even an ordinary Welch’s t-test would work well. (Note that it’s important that it’s the ‘Welch’ version, which doesn’t assume equal variance in the two groups.) For comparison, it gives a p-value of 0.00013.

For summarising the data, you might consider the concordance measure, the c-index, sometimes known as the AUC. (See my explanation on how to how to interpret and calculate it, which includes a couple of graphical representations.)

Karl Ove Hufthammer
  • 5,202
  • 2
  • 23
  • 32
  • Hi - thank you so much for your response! I am trying to enter my data into 'statsdirect', the software that we have available to use, in order to replicate what you have done (as i have other similar data i need to find trends for). i can either select mann-whitney test or wilcoxon signed rank tests - i assume it is wilcoxon? through this, it asks me to 'select 2 matched columns' - i am unclear as to how i can fit my data into 2 matched columns? i selected my data arranged as above and it came up with '2-sided p=0.25'? please excuse my confusion, I'm not very comfortable with stats! thanks! – nicole Jul 12 '15 at 19:34
  • I'm not certain a t-test would be the best choice given the data however. It is ordinal data which I would strongly suspect does not have equal intervals. Nicole, the test described above goes by various names unfortunately (See https://en.wikipedia.org/wiki/Mann%E2%80%93Whitney_U_test). It does not seem like your data is matched either (i.e., related or repeated samples) since each person either had or did not have an adverse event. You want the Mann-Whitney U test. – Marcus Morrisey Mar 29 '17 at 15:06