2

I have a running process that pings multiple servers to check they are alive. If a server is taking a long period of time to respond (>10 seconds) then this system is actioned.

I plan to automate the task of determining when to take an action on a server. Possible option is to check the response time of each system and if it exceeds threshhold then do action. Drawback of this approach is that it does not take into account that the system may have been getting slower over time and just when threshhold reached the action is taken. Also it does not cater for what initial response time may have been.

I think linear regression is a better solution, as overall response times are considered instead of most recent response time. Specifically simple linear regression as using one value to predict - response time.

These are my options using linear regression in order to make decision wether or not to take action on a server :

  1. If the slope of the line between first data point and most recent data point exceeds a particular value (at least is increasing) then take action.

  2. Checking if the standard deviation exceeds value then take action.

  3. If error of prediction exceeds value then take action.

action/actioned in above text is variable - alert/remove

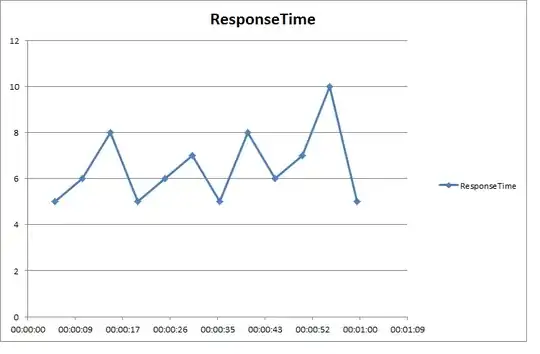
Here is sample dataset plotted (with no regression line).

Y axis - response time

X axis - time in seconds since 0

enter image description here

Is what ive stated in the question correct? Which option should I choose for prediction ? Is linear regression a good choice ?

blue-sky
  • 609
  • 1
  • 7
  • 17

2 Answers2

1

As I understand your application and available data, I believe it's better thought of as an anomaly-detection problem than a prediction one. That is, I have interpreted your question as, "Given a recent history of response times, how can I decide whether a long response time is an abnormality?"

Incidentally, monitoring machines in a data center is one example given in the introduction to anomaly detection in Andrew Ng's ML course. The first few videos in this series illustrate an approach that can be applied to your problem. In this approach, you would use your data of response times to estimate a density function for non-anomalous examples, and then use cross-validation to set a threshold density that would indicate an anomaly.

It would also require a little modification, in that a density threshold could indicate a response time that was anomalously fast, which you are not interested in. (I've linked to the first video, but the videos up through the fourth in the section are relevant.)

If I've misinterpreted your question and you are interested in predicting actual response times, then regression is the choice. But since the observed data are non-negative, a gamma generalized linear model is better-suited. (Answers to this question describes when to use a gamma GLM.) I suspect that time since the beginning of (some arbitrary) period would fall short as a predictive feature, as it wouldn't account for things like daily traffic rhythm.

To gain some intuition about this, recall the assumed model of a (simple univariate) linear regression:

$$y_i = \beta_0 + \beta_1 x_i + \epsilon_i$$

$$\epsilon \sim N(0,\sigma)$$

(Note that this is very different from finding the slope of the line drawn between first and last points.) Applying this to your case, linear regression assumes that response time is the product of some number $\beta_1$ and time since the period began. Because time since is, by definition, increasing, this amounts to assuming that response times will grow or shrink over the course of the period.

I'm no server expert, but this seems a blunt and unrealistic assumption. A model that accounts for heavy-traffic times of day seems more realistic, as it accounts for all of the people using their lunch break to share photos of cats. This is available from your data, you'd simply have to transform the time it was sent. But these are admitted hunches on my part, and I suggest that you test them, or any regression approach, with data regarding when servers actually needed an action.

But again these strike me as very elaborate, and mostly tangential to your real aim of deciding when to act on a server. More, you don't have much data to work with: All you really know is response length and when the request was made. Given this, it seems much more straight-forward to cross-validate an anomaly detection method for each server, or use the statistical process control method referenced in the other answer.

Sean Easter
  • 8,359
  • 2
  • 29
  • 58
  • instead of time since beginning of period can you suggest an alternative predictive feature? How about total number of response times taken. I struggle to find what a good predictive feature on x axis could be. Can you elaborate on why this falls short as a predictive feature? Daily traffic rhythm does not affect the regression line ? I agree anomaly detection is a better methodology bit I would like to use linear regression and then anomaly detection (perhaps local outlier factor) to prove this – blue-sky Jul 19 '15 at 08:17
  • Sure, I'll elaborate once I'm back at my desktop machine. Do you have any metadata associated with the requests and responses? Is anything known other than response time? – Sean Easter Jul 19 '15 at 15:19
  • I may be able to access number of router hops as part of each heartbeat request. Each ping has a different frequency in terms of when heartbeat is sent. So I just have access to ping/heartbeat response time and time heartbeat was sent – blue-sky Jul 19 '15 at 15:33
  • @blue-sky edited to elaborate, hope that helps. – Sean Easter Jul 19 '15 at 16:49
  • thank you by "you'd simply have to transform the time it was sent" is equivalent in meaning plot the send times on the x axis of regression graph ? – blue-sky Jul 19 '15 at 17:26
  • 1
    Not quite, what I mean is that if you want your model to consider any feature based on time of day, it's available to you from the request time. For a simple example, if you wanted to model the average response time for each hour of the day, you could easily get the hour from the time sent. – Sean Easter Jul 19 '15 at 17:30
0

I second the thoughts on outlier detection versus regression and would like to make you aware of the methods of statistical process control . The purpose is for instance checking whether a data point during a production process is "in control" or "out of control". There are two packages in R that come to my mind: qcc and spc.

There is more to it than drawing charts, but using your data and adjusting the confidence interval in the second chart due to the small sample size gives the following:

data <-c(5,6,8,5,6,7,5,8,6,7,10,5)
par(mfrow=c(1,2))
qcc(data, type="xbar.one", center=mean(data), add.stats=FALSE,title="Sample Data Example", xlab="Default Values", restore.par=FALSE)
qcc(data, type="xbar.one", center=mean(data), confidence.level = 0.8, add.stats=FALSE,title="Sample Data Example",xlab="confidence.level = 0.8")

enter image description here

UCL and LCL are the upper and lower control limits respectively.

HOSS_JFL
  • 417
  • 3
  • 11