I have two beta distributions with known parameters:
x <- seq(0,1.0,0.01)
mu1 <- 0.348
mu2 <- 0.619
var1 <- 0.017
var2 <- 0.028
alpha1 <- ((1-mu1)/var1 - 1/mu1)*mu1^2 # constrained to be greater than 1
beta1 <- alpha1*(1/mu1 - 1)
alpha2 <- ((1-mu2)/var2 - 1/mu2)*mu2^2 # constrained to be greater than 1
beta2 <- alpha2*(1/mu2 - 1)
betad1 <- dbeta(x, alpha1, beta1)
betad2 <- dbeta(x, alpha2, beta2)
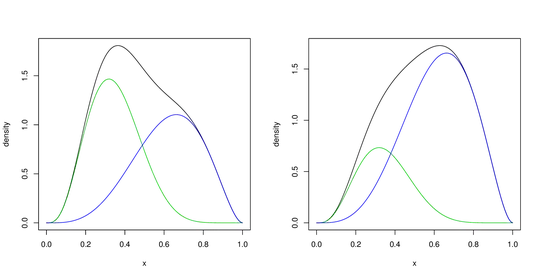
plot(x,betad1,ylab="density",col='green')
points(x,betad2,col='blue')
(I didnt manage to insert my graphical outpout but it should be straighforward to plot)
I would like to do two things,
- Plot the mixture distribution formed by betad1 and betad2
- Find a set of single beta and alpha parameters (or mu and sigma) giving the best representation of this mixture.
For point number 1, I tried the method shown in this post, which is very useful but mixdist does not allow for beta distributions to be used: is there an similar package for a beta densities mixture?
For point number 2, I believe the best thing I can do is to "approximate" the bimodal mixture with a unimodal beta pdf, and calculate its parameters. I am unsure what is the best approach for this. Alternatively, is there there a standard way to characterize a mixture with a single set of parameters?