I have a set of points along an interval. What is the best significance test to measure clustering of the points in the interval (deviation from a uniform distribution)?
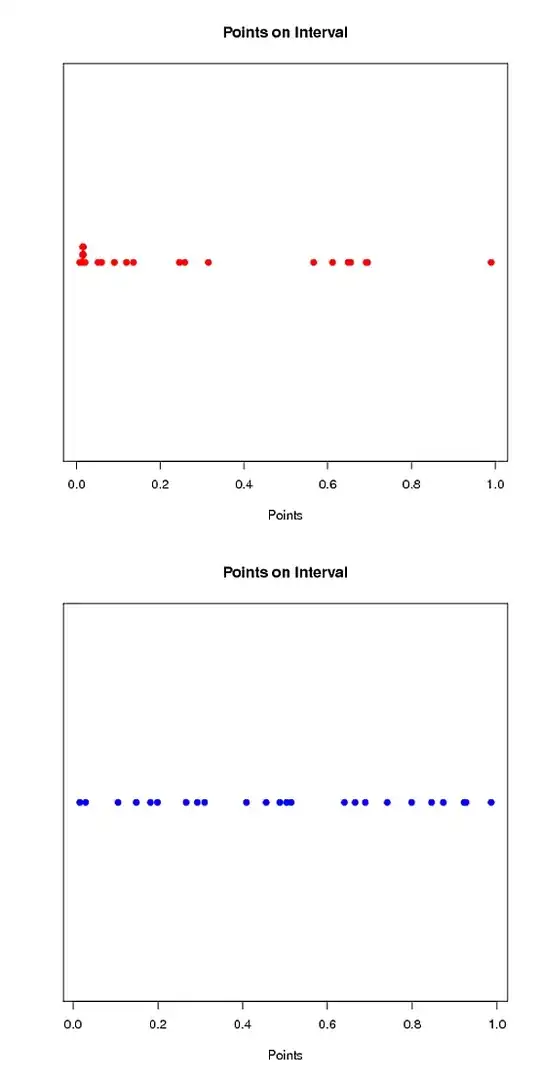
I've added two examples below - clearly by visual inspection, the red series is clustered while the blue series is more evenly distributed across the interval. I'm looking for a significance test to identify this clustering.
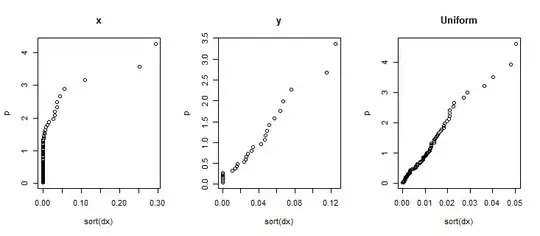
I have attempted to use a number of tests including the KS-test, but this has problems with points in the middle v. at the beginning and end (see: KS test for Uniformity)
A significant limitation here is the number of data points (most likely cannot implement a chi-squared test).
Here are the example sets:
Example Set 1:
[1] 0.007257242 0.010597715 0.010633415 0.011403509 0.014274786 0.014274786
[7] 0.014601183 0.014611383 0.014616483 0.014621583 0.014647083 0.014647083
[13] 0.014647083 0.014692982 0.014692982 0.014703182 0.014703182 0.014718482
[19] 0.014738882 0.014743982 0.014759282 0.014764382 0.014764382 0.014789882
[25] 0.014810282 0.014810282 0.014866381 0.014866381 0.014866381 0.014866381
[31] 0.014866381 0.014871481 0.014871481 0.014871481 0.014876581 0.014876581
[37] 0.014891881 0.014891881 0.014891881 0.014891881 0.015070379 0.015070379
[43] 0.015146879 0.015146879 0.015151979 0.015151979 0.015151979 0.015162179
[49] 0.015172379 0.015172379 0.015177479 0.015177479 0.015345777 0.015427377
[55] 0.015427377 0.020063239 0.051172991 0.059077927 0.090044880 0.118604651
[61] 0.135638515 0.245542636 0.258465932 0.314723582 0.566289270 0.611383109
[67] 0.648434313 0.648434313 0.654238066 0.691605467 0.695608935 0.990172379
Example Set 2:
[1] 0.01579036 0.01579036 0.02972629 0.10616355 0.10616355 0.14897223
[7] 0.18280039 0.19935524 0.26667997 0.29327766 0.40871955 0.40871955
[13] 0.45590335 0.48782180 0.50356611 0.50356611 0.51465283 0.64006079
[19] 0.66558696 0.68946746 0.68946746 0.74137026 0.79837890 0.84520041
[25] 0.87293410 0.87293410 0.92225480 0.92225480 0.98610399
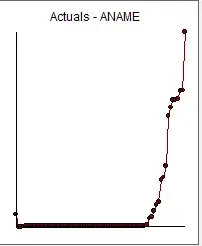 which took into account non-constant error variance (visually obvious). Two tabular presentations
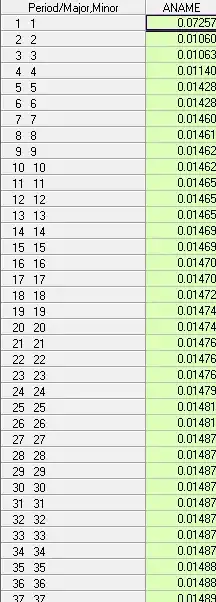
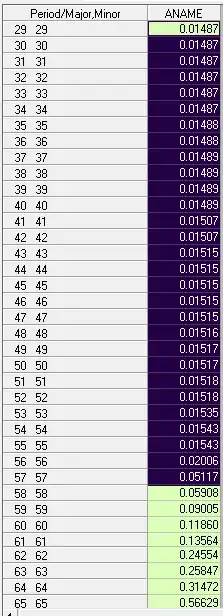
 . Looking at the second table the 58th value is .05908 . A more correct conclusion might have been point 57 .05117 but AUTOBOX for speed purposes does not evaluate each and every point in time. One could conclude that values from 0. to .02006 (the 56th value) were significantly different from the values from period 57 to 72. In this way one could then re-enter AUTOBOX with values 1-56 to identify possible sub-breaks AND values 57-73 to identify possible sub-breaks.In this iterative manner one might be able to solve your VERY thorny problem. The lack of any other response to your questions suggests that the resident experts have been baffled. Hope this helps.