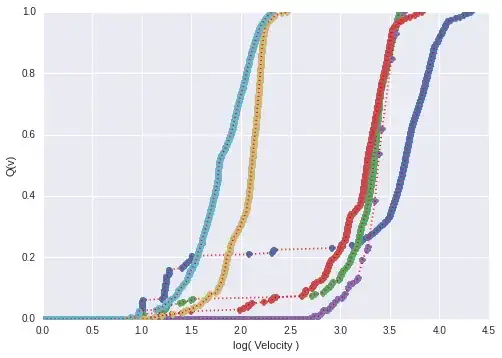
I measured the velocity of particles depending on some biophysical conditions (summarized data from two DoE plans) for about 100 samples. The goal was to identify the most important parameters (which workes well for the unflocculated samples). The figure below shows the measured CDF for well flocculated (purple, red, green), unflocculated (aquamarine, brown) and one incomplete flocculated sample (blue).
If I add too much flocculation agent, sometimes the flocculation is incomplete. I would like to know if some parameter combination causes such a behaviour.
What I tried so far:
ANOVA for linear and quadratic models
Lasso and Elastic for the 10 % percentile.
Calculating the pearson correlation coefficient between each curve, subsequently the adjacency matrix and clustering using igraph. Using the labeled groups, I tried different cluster algorithms (SVC (linear, rbf) and KNN). Although it would be intuitive, to expect three clusters to occur (flocculated, unflocculated, partly flocculated), the partly flocculated samples cannot be resolved very well and sometimes even flocculated samples correlate well with unflocculated samples (I samples 1000 points of the dotted-red lines between 0 and 1 for each curve).
All of the methods I tried so far did not work well. At least not better than educated guessing using the amount of flocculation agent as basis.
One outcome of the experiments might just be, that it is not possible to extract more information from the limited data.
Do you have any other suggestions how these CDF`s could be compared or clustered ?