4

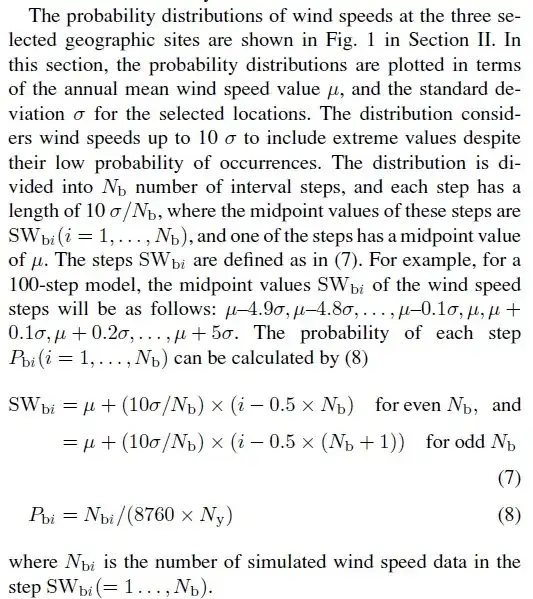
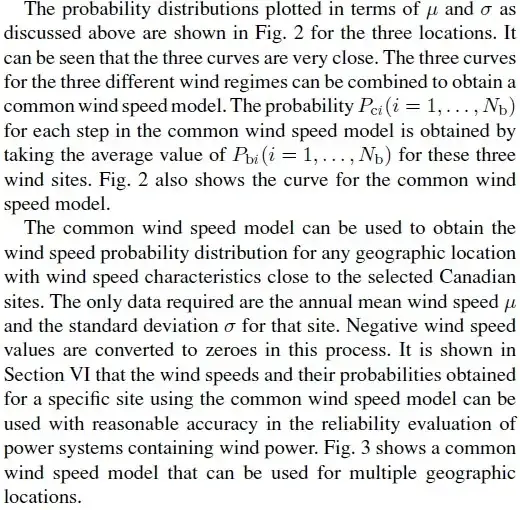
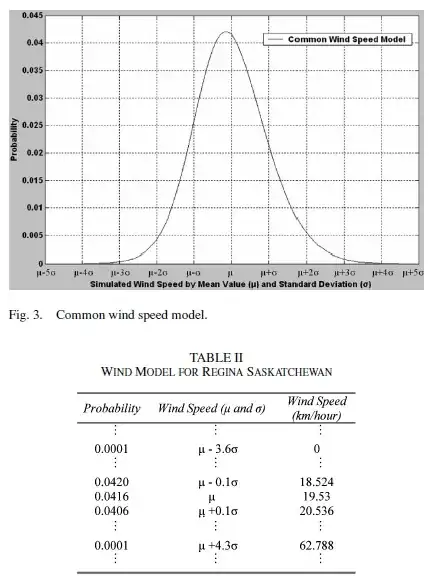
Figure 2 is a Weibull distribution of three different wind farms in Canada. These 3 probability distributions were combined in a study to obtain a common wind speed model. I will be using this common wind speed model to obtain the wind speed probability distribution of a particular wind farm.

Common Wind Speed Model

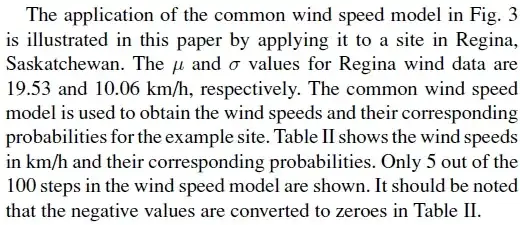
Table II shows the 5 of 100 steps in the model for a sample site used in the study. I know how to compute the wind speed, given that I have the mean and standard deviation of the wind farm. The problem is how will I compute for the specific probability for every speed if I do not know how to recreate the common wind speed model.

Is it possible to use Excel for this?

enter image description here

enter image description here enter image description here enter image description here

All images are from here

Lara
  • 41
  • 1
  • 3
  • 1
    Note that Table II is misleading: it must be providing probability *densities*, not "probabilities" as claimed. Because the study is behind a paywall, you cannot expect readers to know the details. In particular, how many parameters do these Weibull distributions have? Are you sure the study does not report the parameter values? (It would be strange if they did not.) – whuber Jul 01 '15 at 13:20
  • Hi @whuber. I have added images of the paragraphs pertaining to the said table. The mean and sd of each of the three sites are given and used to create their corresponding weibull using the formulas above. Then they were combined into one weibull? How exactly? I understand that the probability is an average of the three. Another queston: If I already solved the value of shape and scale parameters for the regina site, can I use it for the particular site that I will be evaluating? In short, are they constant? – Lara Jul 01 '15 at 18:09

1 Answers1

1

See also: Weibull distribution parameters $k$ and $c$ for wind speed data - a very similar question, as it turns out. I'm pasting the relevant process below (assuming a 2-parameter Weibull).

You can use the 'method-of-moments' to estimate the parameters.

If $\lambda$ is the scale parameter and $k$ is the shape parameter, then:

$$ \mathrm{E}(X) = \lambda \Gamma\left(1+\frac{1}{k}\right)\ $$

$$ \textrm{var}(X) = \lambda^2\left[\Gamma\left(1+\frac{2}{k}\right) - \left(\Gamma\left(1+\frac{1}{k}\right)\right)^2\right]\, $$

This system can estimate values for $k$ and $\lambda$.

$$ k = (\frac{\sigma}{\bar x})^{-1.086} \\ \lambda = \frac{\bar x}{\Gamma(1 + 1/k)} $$

With $\bar x$ as the observed mean and $\sigma$ as the observed standard deviation.

This is of course implementable in Excel:

Call B1 the observed mean, and B2 the observed variance. Call B4 to be the estimated $\lambda$ and B5 to be the estimated $k$, I entered dummy values of 1 to begin with.

Then, define B7 as E(X) and B8 as Var(X). Use the formulas above, I've reproduced mine below:

=(B4*EXP(GAMMALN(1+(1/B5)))) =B4^2*(EXP(GAMMALN(1+(2/B5)))-EXP((GAMMALN(1+(1/B5))^2)))

Define B10 as the squared sum of errors in your estimation: =SQRT((B7-B1)^2+(B8-B2)^2).

Then, with Solver, minimize B10 while changing B4 and B5. This should yield a very good estimate of the true parameters. My spreadsheet gives $\lambda=0.708$ and $k=0.244$.
Chris
  • 11
  • 2
  • This might be useful, but the equations cannot be solved as you state. This is an approximation. – soakley Jul 02 '15 at 02:02
  • @Chris What is the value of the gamma? – Lara Jul 02 '15 at 02:35
  • @soakley you mean I cannot use those equations given by Chris in my evaluation? Please elaborate. Thanks. – Lara Jul 02 '15 at 02:36
  • You can use them (many approximations are good, it's just not always easy to know when). But if you are going to implement in Excel, you might as well use the solver and find the parameters that match the moments more accurately. There is no direct gamma function in Excel. You have to exponentiate the gammaln function. So, for example, to find the gamma function at 5, you would use "=exp(gammaln(5))" – soakley Jul 02 '15 at 13:15
  • I added a solution using Solver, hope it's easy enough to follow. – Chris Jul 02 '15 at 19:08
  • 2
    @Lara there are several other approaches like maximum likelihood, besides method of moments described by chris. This is pretty standard in any standard wind engineering books, I vaguely remember this when I took an aerodynamic class. Comprehensive list of approaches and equation can be found in the [article](http://www.repositorio.ufc.br/bitstream/riufc/2603/1/2011_art_cfandrade.pdf) with an example. – forecaster Jul 02 '15 at 19:38
  • @soakley: It may depend on your version of Excel. MIne (Excel 2013) does have a direct Gamma function: `=GAMMA(5)` gives `24` – Henry Nov 11 '15 at 07:32