2

Fitting quadratic polynomial

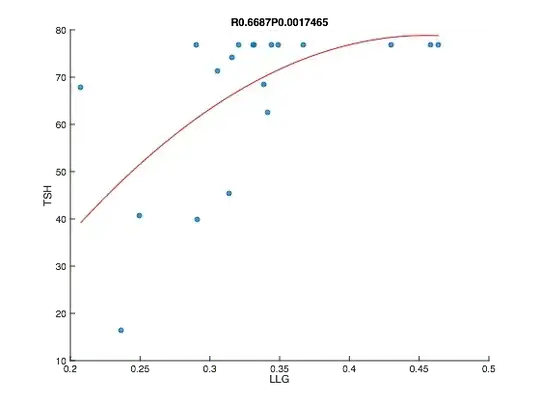
Above is the scatter plot of my data. The spearman's rho was 0.66 which was significant (p<0.005). I draw the fitting line using polynomials. My question: is it OK to choose arbitrary function for fitting line in this case? If so, what would be the best function for the curve fitting?

Fitting unimodal spline

Above was drawn according to the below recommendation by Glen_b (Thanks a lot). Below is the R code for it.

install.packages('uniReg')
library(uniReg)

x <- read.delim('clipboard', header=FALSE)
y <- read.delim('clipboard', header=FALSE)

fit <- unireg(x$V1,y$V1,g=5,sigma=2)
z=seq(min(x$V1),max(x$V1),length=201)
uf=with(x,fit)
plot(x$V1, y$V1,type = 'p', col = 'blue', pch=16, xlab="LLG", ylab="TSH")
lines(z,uf$unimod.func(z),type = 'l', col = 'red' )
  • Since presumably you chose a rank correlation because you want monotonic association, you presumably should use a fit of a monotonic function (which suggests not just using polynomials, which in general form are not monotonic), but you haven't said any more about what you're assuming (monotonic doesn't imply smooth, for example, but I assume you want some degree of smoothness as well. There are monotonic regression splines; for example the function used [here](http://stats.stackexchange.com/questions/158727/avoiding-a-spline-dip/158728#158728) to fit unimodal splines also does isotonic splines – Glen_b Jun 30 '15 at 02:35
  • ctd ... however, it also looks like "80" is acting like some kind of upper bound; if you have bounded variables you should definitely take account of that when arriving at some fit. – Glen_b Jun 30 '15 at 02:36
  • Thanks for quick and solid reply. Y represents the level of Thyroid Stimulation Hormone and it seems to have biological upper bound. So you are saying it is OK that I show the monotonic association applying Spearman's correlation and present a scatter plot with regression splines – Yong Wook Shin Jun 30 '15 at 03:23
  • There's no specific "smooth monotonic fit" associated with a Spearman correlation, so any reasonable choice should be fine. See my answer [here](http://stats.stackexchange.com/a/132899/805) for some discussion. There's *Iman-Conover* isotonic rank regression, which regression ranks on ranks and then use interpolation between observations corresponding to partial ranks to compute the fit --- but it's not smooth. – Glen_b Jun 30 '15 at 04:11
  • I'm not at all convinced the question there is close enough to call a duplicate (feel free to express an opinion on that), but the answer would be quite similar. To be honest, even if the question was more like this one, I think this may be a more canonical question. I wonder if I should delete my answer there and repost it here. – Glen_b Jun 30 '15 at 04:23
  • If you want to deal with an upper bound it may be worth transforming (say via an antilogit or something similar, fitting a (more nearly linear) loess curve or a spline curve, and transform back. An alternative would be to perhaps consider some kind of local nonlinear fit. – Glen_b Jun 30 '15 at 04:26
  • I could upload a figure using a unimodal spline fit thanks to Glen_b. – Yong Wook Shin Jun 30 '15 at 10:12
  • That fit looks good, but you want an isotonic spline, not a unimodal one (I mentioned this before). The `unireg` function fits both (among others) -- the argument `constr="isotonic"` should do that, but I'm not sure it's better than your earlier fit; you may also need to change `penalty` and some of the other arguments to get a suitable fit (the default looks too "stiff"). If you only need this one fit, there's no problem; the fit you have is isotonic. I should probably make my comments into some form of answer. – Glen_b Jun 30 '15 at 10:19

0 Answers0