Is there a particular name for bar plots, in which bars are rectangular, with unequal bases?
That is:
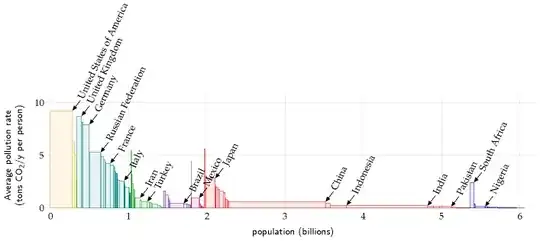
- width represents size (e.g. population),
- height represents intensive variable (e.g. CO$_2$ emission per capita),
- area represents extensive variable (e.g. total CO$_2$ emission).
Example (from David JC MacKay, "Sustainable Energy - without the hot air", page 14):
In the same vein: this and that. Another one: "Real GDP Per Capita and Shares of Global Population" (found here):
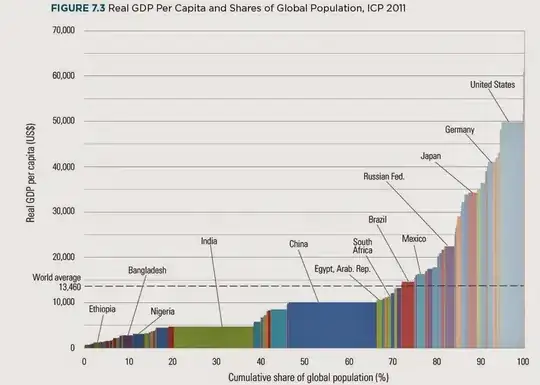
I find these plots immensely useful, as they show both the local effect (is a country particularly rich, polluting, militaristic...) and the global share (of economy/pollution/military power).
I have even made one: Research publications per capita? - Academia.SE. I care for its name both to search for examples, plotting libraries/functions etc, and to propagate this way of presenting data.