2

Following my posted data here, I conducted a k-mean clustering analysis. I refereed to this post: How to produce a pretty plot of the results of k-means cluster analysis? for the clusters visualization

# Read and Sort Input Data
mydata <- read.csv(file="three_county_6_25.csv", head=TRUE, sep=",") # read input data
mydata2 <- scale(mydata)  # Normalize the data

# Determine number of clusters
wssplot(mydata2)
set.seed(1234)
nc <- NbClust(mydata2, min.nc=2, max.nc=15, method="kmeans")
table(nc$Best.n[1,])

# Do K-means clustering
set.seed(1234)
fit.km <- kmeans(mydata2, centers = 3, nstart=25)

 # Visualize the clusters
 # Fig 1
 plotcluster(mydata2, fit.km$cluster)
 # Fig 2
 clusplot(mydata2, fit.km$cluster, color=TRUE, shade=TRUE,labels=2, lines=0)
 # Fig 3
 with(mydata, pairs(mydata2, col=c(1:3)[fit.km$cluster]))

The NbClust indicates 2 clusters: enter image description here
Here are the visualization of clusters:enter image description here
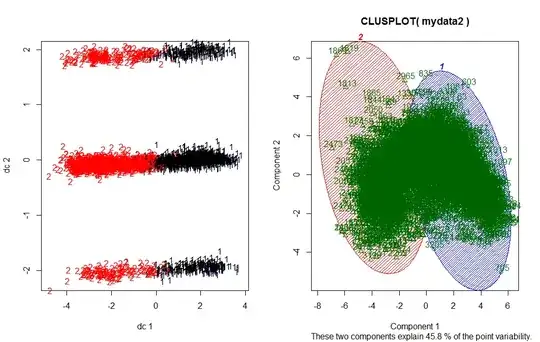
I am not sure how to interpret the clusters visualization result. 1) The 1st cluster plot is doing "Centroid Plot against 1st 2 discriminant functions". It seemed the clusters showed three groups. 2) The 2nd cluster plot "vary parameters for most readable graph" (referred from Quick-R: Cluster Analysis).

enaJ
  • 567
  • 1
  • 6
  • 11

1 Answers1

2

The data contains correlations.

k-means cannot handle correlations, and failed badly.

Either split your data manually based on the visualization (the left looks reasonable), or use a different algorithm capable of handling linear elongated clusters.

Has QUIT--Anony-Mousse
  • 39,639
  • 7
  • 61
  • 96
  • 1
    Do you think if I do PCA on the data, then do k-means on the PCs, will that solve the correlation problems? I saw a post indicated this solution: http://stats.stackexchange.com/questions/92985/when-plotting-clustering-results-in-the-pca-coordinates-does-one-do-pca-or-clus/92987#92987 – enaJ Jun 26 '15 at 18:01
  • 2
    Sometimes. Sometimes not. Visualize again, and check if A) the results look much better in the visualization, and B) the plot exhibits a real elbow. No elbow in the plot usually indicates that kmeans didn't work. – Has QUIT--Anony-Mousse Jun 26 '15 at 20:22
  • 1
    Also, could you guide me to understand why the correlation will fail k-means? I did a quick search, but don't have the fortune to find the exact answer: http://stats.stackexchange.com/search?q=k+mean+correlation – enaJ Jun 26 '15 at 21:27
  • Correlation roughly means scaling one axis, but not another. K-means is *very* sensitive to rescaling axes differently. – Has QUIT--Anony-Mousse Jun 26 '15 at 22:05