Dytham 2010 suggests using the Poisson distribution to establish whether individuals are evenly distributed in space.
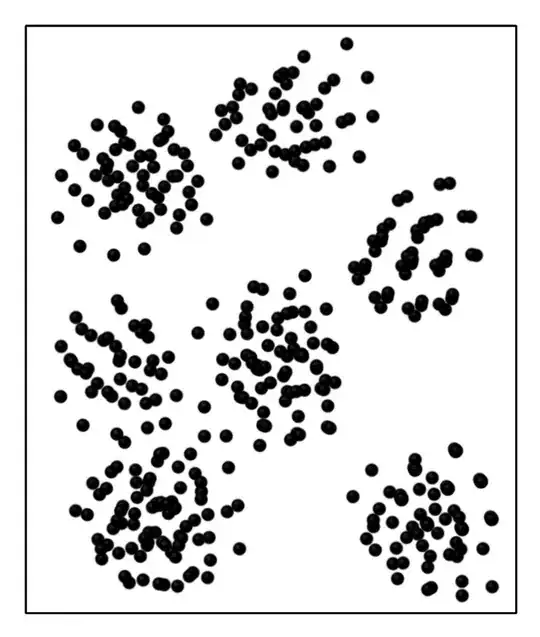
Say we end up with a map of individuals in a study site that looks like the pattern below. The black boundary is the study site boundary and the black points are the location of individuals. Dytham implies dividing the study site into sub-units, counting the number of individuals in each sub-unit and calculating the mean/variance of number of individuals across sub-units. We could then simulate a Poisson distribution with the same mean/variance and seeing how well the observed distribution of individuals matches this simulated Poisson distribution. Given the pattern of spacing of individuals seen below, we would expect a poor fit to the simulated Poisson distribution.
For a long time, I couldn't understand what this poor fit would actually tell us. However, I think the penny has dropped. I think what Dytham is saying is that if the assumptions of the Poisson distribution are met (events are independent and events are random), then the spacing of individuals will be a good fit to a Poisson distribution. But in the image below, we will see a poor fit to the Poisson distribution, therefore indicating that the spacing of individuals isn't random and not independent of each other.
Does it sound like my understanding is correct?