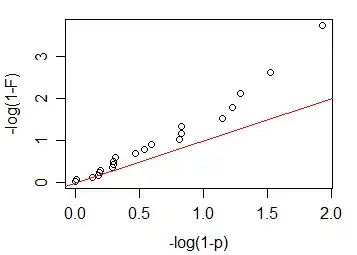
I have multiple individuals, for whom I collected two time series of some parameter. For each individual, I calculated, whether these time series are correlated. So, if I have 20 individuals, as a result I have 20 rho and 20 p-values. Then, I would like to group these values into one group p-value. First, I tried Fisher's method (Wikipedia, MRC wiki).
Here is the MATLAB code example I used, for the sake of reproducibility I provide my input values as well:
pvals = [0.265337997085488
0.00408191031608826
3.39739013503740e-05
0.254982443552454
0.165041294656449
0.416553830442594
0.854810976365062
0.555604221080550
0.256959004076953
0.371337447007835
0.705098835272764
0.122815481253417
0.562862850057724
0.781570743043581
0.248570986138274
0.448488806357779
0.179768419684463
0.560862182877956
0.169198118710575
0.681402534954493
0.723443480957150];
%// pvals is vector of (21,1) shape which holds individual p-values
chi_vals = -2.*log(pvals);
group_pval = 1 - chi2cdf(sum(chi_vals),2*length(pvals));
nsig = sum(pvals < 0.05)
I would have felt that this was enough, but there is something that really got me worried - I get a group p-value of 0.0054, while in my individual p-values there are only 2 values that are "significant" at $p < 0.05$. That doesn't make sense, right? Why is my group p-value so low? Did I make a mistake in calculations or assumptions?
