I have a question about correctness of a model that I used for a fairly simple experiment. I'm not sure if it should go to stackoverflow or crossvalidated, because I feel like my question is both about statistics and programming.
I'm trying to create a hierarchical model in PyMC3 for a study, where two groups of individuals responded to 30 questions, and for each question the response could have been either extreme or moderate, so responses were coded as either '1' or '0'. Each group of individuals contained about 300 people.
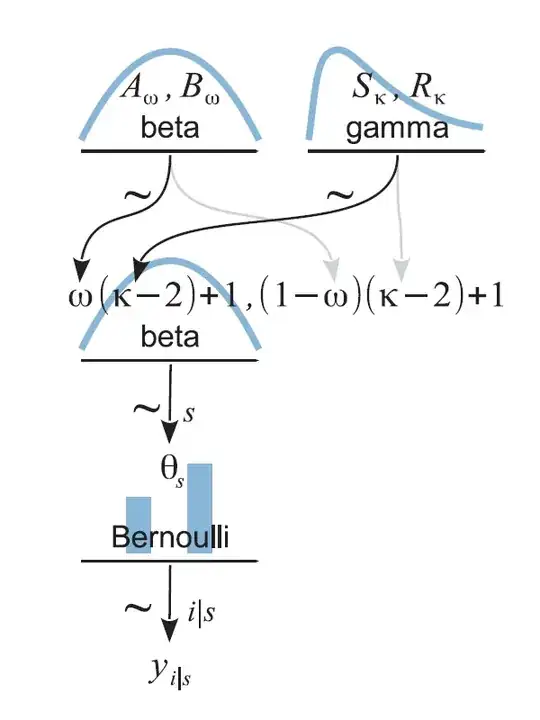
I was reading John Kruschke's DBDA2 book, and I think my model is reasonably similar to a case, where there is a factory which produces coins, with coin biases tied to factory bias. In my case I would have two factories (my two groups) which produced 30 coins (30 questions), and each coin was flipped some amount of times (number of individuals).
I had some trouble figuring it out on my own, so I tried the example model that was provided in the book (page 236, figure 9.7). Here is a diagram:
I coded the model in pymc3 like this, you can try to run it, I provide some example data.
import pandas as pd
import numpy as np
import pymc3

data1 = np.array(pd.read_csv('http://www.becs.aalto.fi/~smirnod1/example1.csv',header=None),dtype=int)
data2 = np.array(pd.read_csv('http://www.becs.aalto.fi/~smirnod1/example2.csv',header=None),dtype=int)

S = 30
s = 0.01
r = 0.01
s_idx = [i for i in range(S)]
with pymc3.Model() as model:
    # group hyperparameters
    k_minus_two1 = pymc3.Gamma('k_minus_two1', alpha=s, beta=r)
    k1 = pymc3.Deterministic('k1', k_minus_two1 + 2)
    w1 = pymc3.Beta('w1', alpha=1, beta=1)

    k_minus_two2 = pymc3.Gamma('k_minus_two2', alpha=s, beta=r)
    k2 = pymc3.Deterministic('k2', k_minus_two2 + 2)
    w2 = pymc3.Beta('w2', alpha=1, beta=1)

    # Priors for individual thetas
    theta1 = pymc3.Beta('theta1', alpha=(w1 * k_minus_two1) + 1, beta=((1-w1)*k_minus_two1)+1, shape=S)
    theta2 = pymc3.Beta('theta2', alpha=(w2 * k_minus_two2) + 1, beta=((1-w2)*k_minus_two2)+1, shape=S)

    # likelihood
    y1 = pymc3.Bernoulli('y1', p=theta1[s_idx], observed=data1)
    y2 = pymc3.Bernoulli('y2', p=theta2[s_idx], observed=data2)

    # difference of proportions
    wdiff = pymc3.Deterministic('wdiff', w1 - w2)

    # Generate a MCMC chain
    start = pymc3.find_MAP() # Find starting value by optimization
    step = pymc3.NUTS(scaling=start) # Instantiate MCMC sampling algorithm
    trace = pymc3.sample(2000, step, start=start, njobs=4, progressbar=True)
In the end I model each group separately. For each group I have mode parameter 'w' and individual theta for each question. I want to know if there is credible difference between proportion of extreme answers between two groups, as indicated by the individual theta parameters. So I tried to calculate wdiff as difference between w1 and w2 to later assess if difference of bias between two groups is different from zero.
Question 1: Am I correct in understanding that wdiff tells me the group difference?
Question 2: Is there other ways to parametrize such model? I'm quite naive, my background is not statistics, so maybe I think in a wrong direction, but I was thinking about having Poisson distribution as a group hyperprior (I understood that Poisson is usually used for count data, and I felt like it can be a prior for Binomial likelihood).
Question 3: For a person who is learning Bayesian analysis, is there some chart of distributions, suggesting which distributions are good for which models?
Thank you in advance!
