1

I am uncertain how to formally establish that I observe a negative relationship between X and Y in multiple sets of linked data points.

I have analyzed several cells in which values of interest (Y) can be estimated at a variety of distances (X) from its center. In any given cell, I expect Y to decrease at greater distances from the center. Despite the expected negative relationship between X and Y, it could be that Y(x=100) > Y(x=30) if these values are derived from different cells.

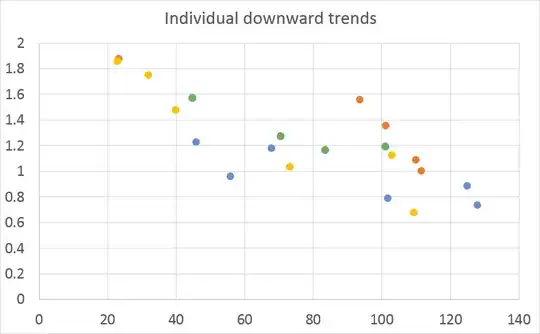
Since the individual downward trends (one for each cell) appear to be shifted with respect to one another, I hardly see a negative relationship if I lump all my Y values together. It is important that I consider the linkage between different Y values which originate from the same cell, shown in a single color in the graph below:

Individual downward trends

I considered doing a repeated measures ANOVA, but fear this is impossible because the X values for which Y is obtained vary between different cells.

What kind of data transformation or test could I use to establish that, for any given cell, Y tends to decrease as X increases?

gung - Reinstate Monica
  • 132,789
  • 81
  • 357
  • 650
Chris
  • 133
  • 4
  • Are you interested in what happens in these exact cells, or are you thinking of these cells as sampled from a population & you're wondering what happens on average to cells in that population? – gung - Reinstate Monica Jun 17 '15 at 20:01
  • Sorry, I should have clarified: I'm wondering what happens on average to/in cells of this type. – Chris Jun 17 '15 at 20:04

2 Answers2

2

What you need is a mixed effects model. If your response variable is continuous, you could probably use a linear mixed model. You will need a cellID indicator variable and you will have random intercepts (and possibly slopes, etc.) for each cell. If that is all of the data you have, you won't have enough to do anything very sophisticated, but you could fit an LMM with random intercepts, which might be good enough for your purposes. (From the plot, you do have different slopes, and red seems to have a strongly curvilinear relationship between X and Y, so ideally, you would have fixed and random effects that could account for that.)

gung - Reinstate Monica
  • 132,789
  • 81
  • 357
  • 650
  • Thank you very much for your suggestion. I must admit that, as a bachelor's student who doesn't specialize in statistics, I have never heard of or used a linear mixed model before. I have a little bit of experience in R and SPSS, so I figured I'd add a cellID column and try to do this analysis in SPSS first. I brought up the linear mixed model dialog, and defined cellID as 'subjects' variable. I didn't declare X or Y as 'repeated' variables, because I found this prevented me from adding Y as the dependent variable later on. With Y as the dependent, and X as factor, I ran the model. – Chris Jun 17 '15 at 21:47
  • Here's is an [overview of what I did and got](http://i.imgur.com/85ICdxR.png). I don't see any test statistics related to the effects of my independent variable X, so I'm not sure if I'm on the right track here. Is there any resource on mixed models you would recommend for somebody with little experience in statistics? P.S.: The data used to generate the graph in the original question was exemplary -- it is not exactly the same data I'm analyzing here. – Chris Jun 17 '15 at 21:54
  • 1
    This is pretty advanced, there may be some statistical support at your university to help. It's been a long time since I've used SPSS, so it's hard for me to say. SPSS will be easier for you to use, though, so you may want to stick with that. UCLA's stats help site seems to have a tutorial [here](http://www.ats.ucla.edu/stat/spss/library/spssmixed/mixed.htm). Looking at your png, you probably want `distance` in the `covariate` box. – gung - Reinstate Monica Jun 17 '15 at 23:42
  • Right, I removed distance as a factor and added it as a [covariate](http://stats.stackexchange.com/questions/70824/what-is-the-difference-between-factors-and-covariate-in-terms-of-anova) instead. I then declared it 'fixed', and got an F and p value proving that its effect on my Y value is insignificant. Granted, this result is a bit anticlimactic, but I'm very happy you took the time to help me out! – Chris Jun 18 '15 at 00:03
  • 1
    You're welcome, @Chris. `distance` is fixed, but you also want random effects of `distance` for each `cellID`. – gung - Reinstate Monica Jun 18 '15 at 00:07
1

To make inference about this relationship you would need multiple tests within a cell. Is that possible? If it is, I would suggest to measure the difference in Y and X relative to the baseline (the smallest X). This way, in each cell the smallest X represents 0 and bigger X's are computed relative to that point. This solution will be problematic if the relationship between X and Y is not a simple linear relationship.

Ivo
  • 411
  • 2
  • 8
  • Thanks for your reply. Indeed, I have multiple values of Y for each cell -- is that what you were asking? I do expect a linear relationship. After changing each X value to reflect distances relative to the first measurement, as I have done [here (bottom graph)](http://i.imgur.com/FqGfhA6.png), would you suggest I simply use linear regression without considering the cell-defined linkages? – Chris Jun 17 '15 at 20:34
  • I would use a (mixed) model whereby you consider the dependencies from the cells. It might be nice to fit a simple linear regression for illustrative purposes, tough. And yes, that was what I was asking. – Ivo Jun 17 '15 at 20:48
  • 1
    And by the way. If you would use a mixed model (that accounts for the structural differences between celll), you wouldn't need to make baseline inference as the model will do that itself (it tests the difference between scores within the cells). – Ivo Jun 17 '15 at 20:53
  • Thanks, [I've given it a shot](http://i.imgur.com/85ICdxR.png), but I'm not sure if I'm doing it right. See also my comment under gung's answer. – Chris Jun 17 '15 at 22:00