1

Suppose I know that the true population proportion of a mutation is p = 0.3493119. I want to know that given power = 0.8, what's the proportion of of mutation in my sample of n = 30? Here's what I have so far:

1 - cdf((x-p)/sqrt(p*(1-p)/30) = 0.8 Since p = 0.3493119, I can solve for x and I get x = 0.276055. So does this mean that the probability of having 27.6% of the sample be mutated = 0.8? Is it correct to say that?

From my experience I know that power is the probability of correctly rejecting the null. But since I already know the true population proportion of the mutation, is it still necessary to conduct a hypothesis test? I am leaning towards the negative, but without a hypothesis test, how can I calculate the power?

If I had to perform a hypothesis test to get the power...would it be something like this:

H0: p = 0.5 vs. H1: p > 0.5

power = P(Z_statistic > critical_value | p > 0.5)

power = 1 - normal_CDF(critical_value | p > 0.5)

Now I'm confused by how to deal with the p > 0.5, if it were just p = 0.5, I could've standardized the critical value so that it follows a N(0, 1) distribution.

Overall I think I just want to know the answer to the question, given power = 0.8, what is the proportion of mutation in my sample of n = 30? (true population proportion = 0.3493119).
Catherine
  • 133
  • 2
  • 4
  • 8
  • I think your hypothese should be Ho: p=0.3493139 and H1:p>0.3493139, Something like that. Since you already stated that the true population proportion is 0.3493119, test p=0.5 vs. p>0.5 seems very strange to me. – Deep North Jun 17 '15 at 00:58
  • @DeepNorth Ok. So power = P(Z > critical value | p > 0.3493139) correct? How do I proceed to find the power? How do I standardize the critical value? Let critical value = c. Would I just do (c - p)/sqrt(p * (1-p) / 30) to standardize the critical value? – Adrian Jun 17 '15 at 01:10
  • 1
    To calcuate a specific power, you also need a specific effect size and type I error level, if you do not have a specific effect size, you can draw a power curve, think. – Deep North Jun 17 '15 at 01:15

3 Answers3

1

I would say "Yes"power is alway associated with hypothesis testing it relates to sample size, type I error and both H1 and H0.

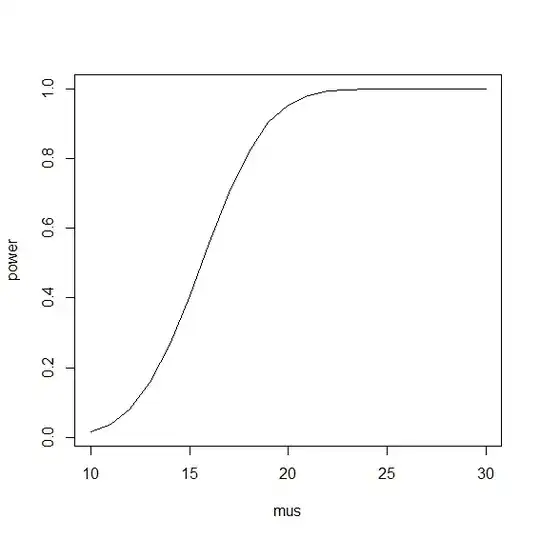
The followings are R code to show the power curve for OP's cases (one tailed at 0.05 level, by approximate a normal distribution.

mu<-30*0.35
sd<-sqrt(30*0.35*(1-0.35))
c<-qnorm(0.95,mu,sd)
mus<-seq(10,30,1)
power = 1-pnorm(c, mus, sd)
plot(mus, power, type="l")

enter image description here

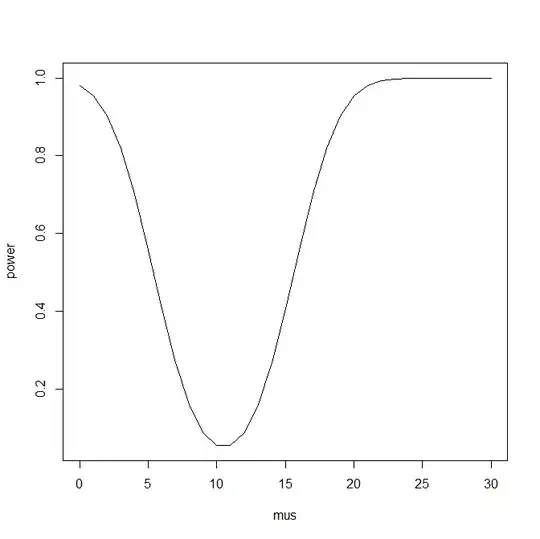
Two tailed case by approximating normal distribution

mu<-30*0.35
sd<-sqrt(30*0.35*(1-0.35))
mu
sd
c1<-qnorm(0.025,mu,sd)
c2<-qnorm(0.975,mu,sd)
mus<-seq(0,30,1)
power2 <- pnorm(c1,mus,sd)+1-pnorm(c2,mus,sd)
plot(mus, power2, type="l")

enter image description here

Deep North
  • 4,527
  • 2
  • 18
  • 38
0

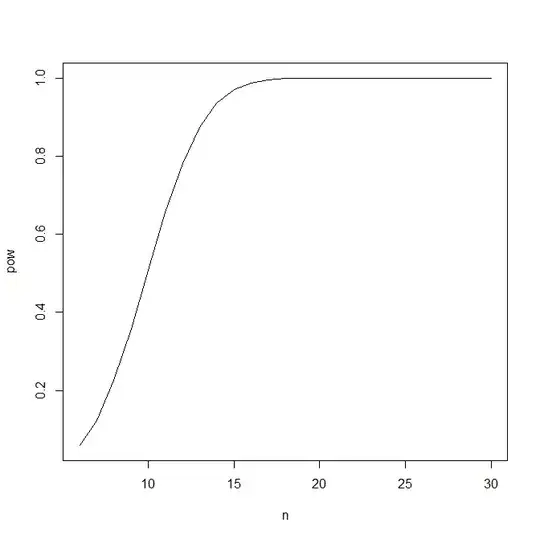
This is for binomail distribution not by approximation.

#under binomail distribution, one tail,
qbinom(0.05,30,0.35) #critical rigion
n<-seq(6,30,1) #numbers bigger than critical region
pow<-pbinom(n,30,0.35)#one tailed test
plot(n, pow, type="l")

enter image description here

Deep North
  • 4,527
  • 2
  • 18
  • 38
0

Your question is not a question about power. Assuming a given population mean, you are interested in predicting the sample mean. If you have a binomial distribution, you can find the density distribution centered over your population mean.

Power would require specification of a criterion value for deviations of sample means from the population mean.

Dr. R
  • 51
  • 1