-1

Hopefully I can explain this clearly. Reference diagram below if needed.

I'm planning a large field experiment that I think will have to be a split plot design.

There are six sites (outlined in red), each with six blocks (separated by green lines). (Sites are of interest and are not random.) In each block there are 20 grids, with five replicates of each of four treatment combinations (from a 2 x 2 factorial of microbial x caging). Each treatment combination is indicated by the colored squares at the top of the diagram. Each grid in the block gets randomly assigned a treatment combination; I think these grids are my "whole plots"...

Within the "cells" of each grid (see inset), there are seeds from 4 sources, each replicated 6 times. (Seed source is also of interest, not random). Each of the 24 cells gets randomly assigned one seed. Each seed source is indicated by the colored circles at the top of the diagram. I think these cells are my "split plots"...

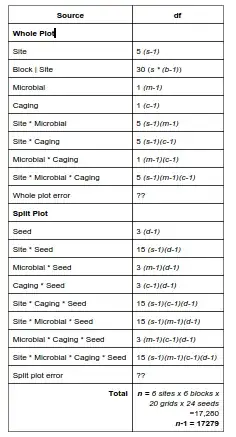
Now, when I'm thinking about the ANOVA table for this...I'm getting confused, and don't know how to calculate the degrees of freedom for error in the whole plot and split plot. And am I thinking about this the right way? Does it seem like adequate replication? (Though I realize that will depend on effect sizes.) I realize the higher level interactions will be hard to interpret but want to sketch out the whole ANOVA table first. What I have at the moment is this:

enter image description here

enter image description here

jwb4
  • 183
  • 1
  • 1
  • 8

1 Answers1

0

Agricolae http://cran.r-project.org/web/packages/agricolae/index.html is a dedicted R package for similar problems. The ssp.plot function is for split-split plot design and is divided into three parts: the main-plot, subplot and sub-subplot analysis.

Further details may be seen here: http://cran.r-project.org/web/packages/agricolae/agricolae.pdf

Example on this page Repeated measures anova and split plot design analysis may be helpful:

> library(agricolae)
> with(mydf, ssp.plot(rat, food, prep, method, glycogen))

ANALYSIS SPLIT-SPLIT PLOT:  glycogen 
Class level information

food    :  T1 T2 T3 
prep    :  P1 P2 
method  :  A B 
rat     :  Remy Templeton Scabbers Splinter Nicodemus Rizzo 

Number of observations:  48 

Analysis of Variance Table

Response: glycogen
                 Df Sum Sq Mean Sq F value    Pr(>F)    
rat               5 4381.4  876.27 262.553 4.798e-06 ***
food              1   35.0   35.02  10.493   0.02297 *  
Ea                5   16.7    3.34                      
prep              1   54.2   54.19                      
food:prep         5   24.9    4.97                      
Eb                                                      
method            5  523.4  104.67                      
method:food                                             
method:prep                                             
method:food:prep                                        
Ec                                                      
---
Signif. codes:  0 ‘***’ 0.001 ‘**’ 0.01 ‘*’ 0.05 ‘.’ 0.1 ‘ ’ 1

cv(a) = 1.3 %, cv(b) = NA %, cv(c) = NA %, Mean = 138.8542 

This can easily be adapted to your problem.

rnso
  • 8,893
  • 14
  • 50
  • 94