8

Libre Office has an easy way to calculate and show trade line in a graphic (i.e. right-click on data series and insert trend line). Formatting the graphic this way however is not really easy because the linear regression cannot be shown without the data series and drawing the linear regression only is precisely what I want.

I'm not trained in statistics, although I understand what a trend line is (with thanks to StackExchange), I don't know how to calculate it.

Hence I would like to know: is there any automated means to calculate the trend line on Libre Office, other than the right-click option in the graphics?
Andy W
  • 15,245
  • 8
  • 69
  • 191
neydroydrec
  • 581
  • 2
  • 6
  • 10

3 Answers3

9

LibreOffice's help explains how trend lines are computed. You will see that the work is done through two functions: INTERCEPT and SLOPE.

If you are interested in linear regression, you should also have a look at the LINEST function.

6

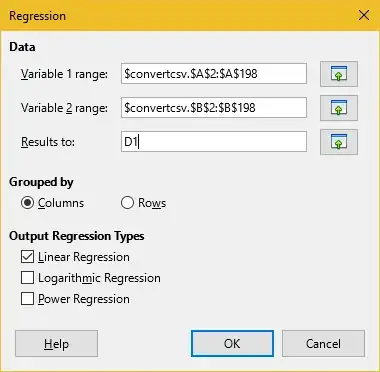
LibreOffice did add this feature in version 5.1 early last year. To generate this, select your data, click the "Data" menu, and go to the bottom for "Statistics" > "Regression". This will give the following dialog:
LibreOffice Regression dialog box

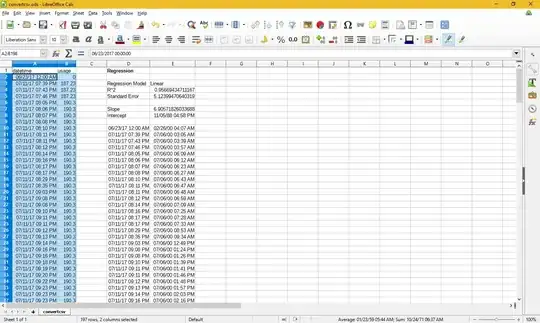
Enter the top-left corner of where you want your results to be generated, hit OK, and voila:
linear regression generated in LibreOffice Calc

Ullallulloo
  • 161
  • 1
  • 4
1

There is a somewhat similar question on Quantitative Finance here where one answerer warns against using LibreOffice. Perhaps another answerer's response to use R might be appropriate for you too?

babelproofreader
  • 4,544
  • 4
  • 22
  • 35