24

I'm trying to layout for myself when it's appropriate to use which regression type (geometric, Poisson, negative binomial) with count data, within the GLM framework (only 3 of the 8 GLM distributions are used for count data, although most of what I've read centers around the negative binomial and Poisson distributions).

When to use Poisson vs. geometric vs. negative binomial GLMs for count data?


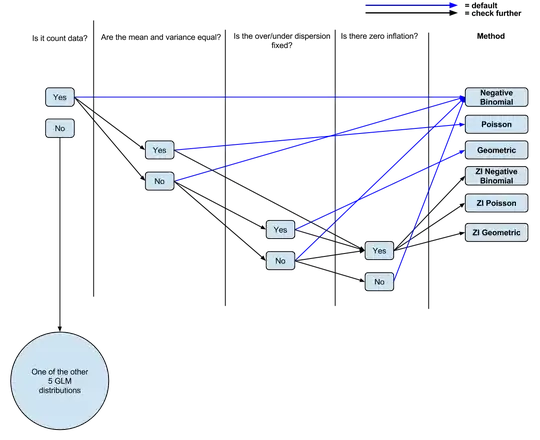
So far I have the following logic: Is it count data? If Yes, Are the mean and variance unequal? If Yes, negative binomial regression. If no, Poisson regression. Is there zero inflation? If yes, zero inflated Poisson or zero inflated negative binomial.

Question 1 There doesn't seem to be a clear indication of which to use when. Is there something to inform that decision? From what I understand, once you switch to ZIP, the mean variance being equal assumption get's relaxed so it's pretty similar to NB again.

Question 2 Where does the geometric family fit into this or what kind of questions should I be asking of the data when deciding whether to use a geometric family in my regression?

Question 3 I see people interchanging the negative binomial and Poisson distributions all the time but not geometric, so I'm guessing there's something distinctly different about when to use it. If so, what is it?

P.S. I've made a (probably oversimplified, from the comments) diagram (editable) of my current understanding if people wanted to comment/tweak it for discussion. Count Data: GLM Decision Tree

amoeba
  • 93,463
  • 28
  • 275
  • 317
timothy.s.lau
  • 1,043
  • 2
  • 11
  • 26
  • I only familiar with R programming, but hope this help... http://stats.stackexchange.com/questions/60643/difference-between-binomial-negative-binomial-and-poisson-regression – Rγσ ξηg Lιαη Ημ Jun 09 '15 at 17:06
  • @RYOENG , I saw that and I've laid out the difference described in my question with the logic tree. I'm especially interested in a less discussed dist., namely the **geometric dist.** – timothy.s.lau Jun 09 '15 at 17:08
  • (UPDATE) @Nick Cox 's answer here: http://stats.stackexchange.com/questions/67547/when-to-use-gamma-glms seems to capitulate the sentiment I've seen thus far searching "It's hard to pin down quite when to use it beyond an empty answer of whenever it works best" – timothy.s.lau Jun 09 '15 at 18:31
  • @Glen_b good catch, I updated the logic. – timothy.s.lau Jun 10 '15 at 04:55
  • You're probably safe removing the paragraph about getting dinged by mods as well. – Glen_b Jun 10 '15 at 04:58

1 Answers1

14

Both the Poisson distribution and the geometric distribution are special cases of the negative binomial (NB) distribution. One common notation is that the variance of the NB is $\mu + 1/\theta \cdot \mu^2$ where $\mu$ is the expectation and $\theta$ is responsible for the amount of (over-)dispersion. Sometimes $\alpha = 1/\theta$ is also used. The Poisson model has $\theta = \infty$, i.e., equidispersion, and the geometric has $\theta = 1$.

So in case of doubt between these three models, I would recommend to estimate the NB: The worst case is that you lose a little bit of efficiency by estimating one parameter too many. But, of course, there are also formal tests for assessing whether a certain value for $\theta$ (e.g., 1 or $\infty$) is sufficient. Or you can use information criteria etc.

Of course, there are also loads of other single- or multi-parameter count data distributions (including the compound Poisson you mentioned) which sometimes may or may not lead to significantly better fits.

As for excess zeros: The two standard strategies are to either use a zero-inflated count data distribution or a hurdle model consisting of a binary model for zero or greater plus a zero-truncated count data model. As you mention excess zeros and overdispersion may be confounded but often considerable overdispersion remains even after adjusting the model for excess zeros. Again, in case of doubt, I would recommend to use an NB-based zero inflation or hurdle model by the same logic as above.

Disclaimer: This is a very brief and simple overview. When applying the models in practice, I would recommend to consult a textbook on the topic. Personally, I like the count data books by Winkelmann and that by Cameron & Trivedi. But there are other good ones as well. For an R-based discussion you might also like our paper in JSS (http://www.jstatsoft.org/v27/i08/).

Scortchi - Reinstate Monica
  • 27,560
  • 8
  • 81
  • 248
Achim Zeileis
  • 13,510
  • 1
  • 29
  • 53
  • so if θ=∞ is equidispersion what would you call θ=1? – timothy.s.lau Jun 09 '15 at 18:55
  • 4
    It's one particular type of overdispersion (because $\mu + \mu^2 > \mu$). In a certain sense the amount of overdispersion is fixed, though, while in the NB the amount of overdispersion is estimated through an additional parameter. – Achim Zeileis Jun 09 '15 at 19:10
  • So connecting your response back to my earlier logic, would you say that the following is accurate?: *Is it count data?* Yes -> *Is there overdispersion (Are the mean and variance equal)?* Yes -> Negative binomial regression No -> Poisson regression ***Is the overdispersion fixed?* Yes -> Geometric regression** *Is there zero inflation?* Yes -> Zero Inflated Poisson or Zero Inflated Negative Binomial – timothy.s.lau Jun 09 '15 at 19:14
  • 3
    No, as I wrote: If I haven't any other prior knowledge, I would start with the NB (not the Poisson). And I would only consider the special case of the geometric distribution if this has an appealing interpretation for my application. More often than not, the main goal is inference about the mean $\mu$ anyway so testing the geometric against the NB is not very interesting. – Achim Zeileis Jun 09 '15 at 19:25
  • I'm a little daft and like to draw out things like this. I've made an editable sketch here: https://docs.google.com/drawings/d/19nm1Zs6ixy7mQ2Oyjg7NcT0c4ncREnCc3G3TL6SqkNc/edit Does this seem more accurate to you? – timothy.s.lau Jun 09 '15 at 20:06
  • 3
    As you might have been able to tell from my previous comments: I'm not a fan of such oversimplifying flowcharts. To choose a good model one needs to understand the connections between the models and their relation to the practical application. Whether or not you might be interested in the geometric depends on the application case you have. Similarly, for zero-inflation vs. hurdle (which you have omitted from your chart). Finally, the order of the questions is not necessarily the same for all applications etc. – Achim Zeileis Jun 09 '15 at 20:23
  • 2
    I get that my sketch seems a bit oversimplified. But for students in sciences it's not uncommon to start with rather simplistic schema's, if you've taken physics classes you're familiar with how often they change and break "rules" you've previously learned, that are the foundation of a later more expert and nuanced comprehension. So for learning sake, I'm a graduate student, I was simply trying to get a more "correct" understanding of the basics that I can build off of later e.g. hurdles etc. Thanks for the references BTW, I'll investigate the textbooks you mentioned as well as your paper. – timothy.s.lau Jun 09 '15 at 20:35
  • The book of winkelmann (5th edition) no sells at amazon.com for $418! – kjetil b halvorsen Jun 15 '15 at 13:55
  • That appears to be a third party offer. Amazon itself or the publisher (Springer, http://www.springer.com/book/9783540776482) also have cheaper versions. – Achim Zeileis Jun 15 '15 at 21:09
  • +1. Very nice tutorial in JSS! Why don't people use quasi-NB more often? I guess with $\theta$ fixed it can be fit by `glm` with appropriately set up `quasi` family, but does `glm.nb` support the "quasi" functionality of estimating both $\theta$ and $\phi$ from the data? If not, are there other established packages that do it? If not, why not? Is there anything wrong with the idea of quasi-NB? It would appear to be more flexible than NB and seems like a natural extension. – amoeba Nov 17 '17 at 10:07
  • 2
    I think that quasi-NB would not add much to quasi-Poisson. You have the same mean function $\log(\mu_i) = x_i^\top \beta$ and you also give up the likelihood (i.e., have only a mean model but not a probabilistic model). So the only difference is that in case of NB2 you have a slightly different variance function while NB1 would even have the very same variance function. Hence, my recommendation would be to simply use quasi-Poisson for a mean regression model - and start with NB if I want to have a probabilistic regression model. – Achim Zeileis Nov 17 '17 at 11:12