15

Are there any documented algorithms to separate sections of a given dataset into different curves of best fit?

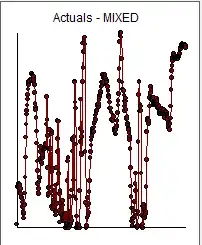
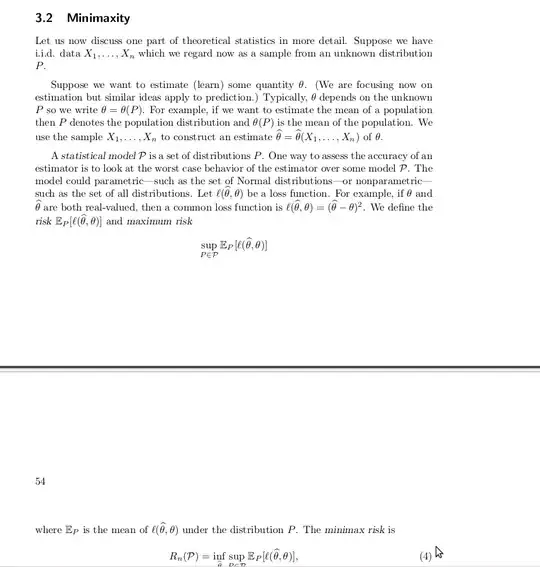
For example, most humans looking at this chart of data would readily divide it into 3 parts: a sinusoidal segment, a linear segment, and the inverse exponential segment. In fact, I made this particular one with a sine wave, a line and a simple exponential formula.

Chart of data with three distinct parts visible

Are there existing algorithms for finding parts like that, which can then be separately fitted to various curves/lines to make a kind of compound series of best-fits of subsets of the data?

Note that although the example has the ends of the segments pretty much line up, this won't necessarily be the case; there may also be a sudden jolt in the values at a segment cutoff. Perhaps those cases will be easier to detect.

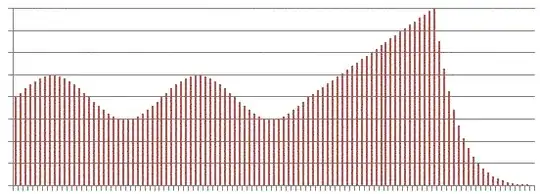
Update: Here is an image of a small bit of real-world data: Real world chart

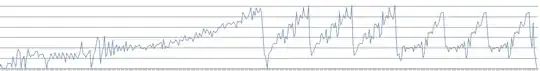
Update 2: here is an unusually small real-world set of data (only 509 data points):

4,53,53,53,53,58,56,52,49,52,56,51,44,39,39,39,37,33,27,21,18,12,19,30,45,66,92,118,135,148,153,160,168,174,181,187,191,190,191,192,194,194,194,193,193,201,200,199,199,199,197,193,190,187,176,162,157,154,144,126,110,87,74,57,46,44,51,60,65,66,90,106,99,87,84,85,83,91,95,99,101,102,102,103,105,110,107,108,135,171,171,141,120,78,42,44,52,54,103,128,82,103,46,27,73,123,125,77,24,30,27,36,42,49,32,55,20,16,21,31,78,140,116,99,58,139,70,22,44,7,48,32,18,16,25,16,17,35,29,11,13,8,8,18,14,0,10,18,2,1,4,0,61,87,91,2,0,2,9,40,21,2,14,5,9,49,116,100,114,115,62,41,119,191,190,164,156,109,37,15,0,5,1,0,0,2,4,2,0,48,129,168,112,98,95,119,125,191,241,209,229,230,231,246,249,240,99,32,0,0,2,13,28,39,15,15,19,31,47,61,92,91,99,108,114,118,121,125,129,129,125,125,131,135,138,142,147,141,149,153,152,153,159,161,158,158,162,167,171,173,174,176,178,184,190,190,185,190,200,199,189,196,197,197,196,199,200,195,187,191,192,190,186,184,184,179,173,171,170,164,156,155,156,151,141,141,139,143,143,140,146,145,130,126,127,127,125,122,122,127,131,134,140,150,160,166,175,192,208,243,251,255,255,255,249,221,190,181,181,181,181,179,173,165,159,153,162,169,165,154,144,142,145,136,134,131,130,128,124,119,115,103,78,54,40,25,8,2,7,12,25,13,22,15,33,34,57,71,48,16,1,2,0,2,21,112,174,191,190,152,153,161,159,153,71,16,28,3,4,0,14,26,30,26,15,12,19,21,18,53,89,125,139,140,142,141,135,136,140,159,170,173,176,184,180,170,167,168,170,167,161,163,170,164,161,160,163,163,160,160,163,169,166,161,156,155,156,158,160,150,149,149,151,154,156,156,156,151,149,150,153,154,151,146,144,149,150,151,152,151,150,148,147,144,141,137,133,130,128,128,128,136,143,159,180,196,205,212,218,222,225,227,227,225,223,222,222,221,220,220,220,220,221,222,223,221,223,225,226,227,228,232,235,234,236,238,240,241,240,239,237,238,240,240,237,236,239,238,235

Here it is, charted, with the appoximate position of some known real-world element edges marked with dotted lines, a luxury we won't normally have:

enter image description here

One luxury we do have, however, is hindsight: the data in my case is not a time series, but is rather spatially related; it only makes sense to analyse a whole dataset (usually 5000 - 15000 data points) at once, not in an ongoing manner.

whybird
  • 203
  • 1
  • 10
  • One possibility would be to fit the whole family of curves at once, using a meta-model. To make things more precise, suppose your ultimate objective is to smooth that histogram, say using a KDE. Then, your smooth estimation from the KDE will be more precise if you use a model in which the width of the kernel is allowed to vary over the range of values of $x$ as in the model used [here, equations (2)-(3)](http://arxiv.org/pdf/1202.2194.pdf) – user603 Jun 12 '15 at 10:51
  • 1
    You constructed the example so that the idea makes sense: so far, so good. With real histograms, it is much more common that a complicated shape reflects a mixture of overlapping distributions: the interest is not then in changepoints on the observed histogram which generally don't exist convincingly or are not the right way to think about mixtures. It's possible, however, that you are using "histogram" in a much broader way than is standard in statistical science where it means bar chart of frequency or probability distribution (only). – Nick Cox Jun 12 '15 at 11:36
  • @IrishStat - the usual datasets have 5000 to 15000 entries. I was trying to prepare a summarised real one for here, but it turned out to be a bad example, and I had to start over. On the other hand, doing that did suggest a partial answer to me in terms of simply smoothing and averaging clumps of data for looking initially for patterns, to be finessed later so thanks for that :) I have a real one thats only 509 wide that looks like it could be good; I'll add that to the question when I can. – whybird Jun 12 '15 at 12:31
  • @user603 - thank you, that looks very useful, especially section 2.2, and I will be reading it in detail in the morning (I am no doubt in a very different timezone than a statistically significant number of you on here :) ) – whybird Jun 12 '15 at 12:34
  • @NickCox - Thanks, yes, I used the word histogram incorrectly. I'll edit the question appropriately. I'm not a statistician, and it is entirely likely that I am inadvertently using other terms incorrectly as well. What I have is a stream of measurements with values which will be 0-255 in practice in my specific example. Patterns observable in the data, in order, will represent real-world phenomena. – whybird Jun 12 '15 at 12:40
  • Please post the 509 values . – IrishStat Jun 12 '15 at 12:59
  • Maybe not precisely what you are looking for, and I'm not sure what software you use or have available, but I would look into algorithms for fitting different forms of restricted cubic spline or LOESS smoothers. They are often used in exploratory data analysis to look for sudden changes in functional form for variables in regression analyses. I don't know off-hand how flexible they are in detecting the wide range of scenarios you submit in your OP, but I know they are at least capable of finding the inflection point between, say, linear and a cubic equation over different ranges of a variable. – Ryan Simmons Jun 12 '15 at 17:45
  • @RyanSimmons thank you! I have just read up on the basics of LOESS and it does appear to be a very good starting point for what I need. I'll be fitting up to cubic polynomials, but I do also expect sine waves. Perhaps the exponential parts can be adequately modelled with half of a parabola. I also expect to have to look for repetition anyway (see the sawtooth in one of my diagrams) so perhaps even a repeated cubic function could approximate a sine wave. Thanks again! – whybird Jun 13 '15 at 04:04
  • As for what software I have available, well, I'm writing custom software. I'm writing it in C# initially, but really what I am after is algorithms, so the language is not that relevant. – whybird Jun 13 '15 at 04:13
  • Jaded by the fact that I build hammers (and very good ones at that), I refer to your problem as a "Single Dimension Cluster Analysis Problem" as you wish to create a minimally sufficient number of clusters based upon 1 characteristic (Y). Perhaps you might want to re-title the question. – IrishStat Jun 15 '15 at 19:06
  • I'm deeply appreciative of all the pointers to hammers, screwdrivers and socket wrenches in all the answers, as all I had before was a rock, a butter knife and a rusty pair of pliers. Having said that, as for the title, had I known the correct statistical terms in the first place, I may not have needed to ask. I don't have the rep here for my input to be heavily weighted (and congrats on the 10k @IrishStat), but I'd suggest that the title given may help noobs like myself find it. – whybird Jun 15 '15 at 23:05
  • @IrishStat, @ MikeHunter - I had real difficulty choosing which answer to accept and award the bounty to; both were immensely helpful. It looks like I'll actually be pursuing some of the stuff in Eamonn Keogh's papers first, so i have gone with Mike's. – whybird Jun 19 '15 at 04:57

3 Answers3

3

Detecting change points in a time series requires the construction of a robust global ARIMA model (certainly flawed by model changes and parameter changes over time in your case ) and then identifying the most significant change point in the parameters of that model. Using your 509 values the most significant change point was around period 353. I used some proprietary algorithms available in AUTOBOX (which I have helped develop) that could possibly be licensed for your customized application. The basic idea is to separate the data into two parts and upon finding the most important change point re-analyze each of the two time ranges separately (1-352 ; 353-509 ) to determine further change points within each of the two sets. This is repeated until you have k subsets. I have attached the first step using this approach. Visually it appears to me that the most important point change point has been identified. enter image description here

enter image description here

IrishStat
  • 27,906
  • 5
  • 29
  • 55
  • 1
    Why does 353 get flagged when 153 and 173 have lower P-values? – Nick Cox Jun 13 '15 at 11:55
  • 1
    @NickCox Good question ! Great comment For forecasting purposes the whole idea is to separate the most recent (significant) subset from the older subset which is why 353 won .... For purposes here one would indeed select 173 . – IrishStat Jun 13 '15 at 13:33
  • The title "MOST RECENT SIGNIFICANT BREAK POINT" attempts to tell the story – IrishStat Jun 13 '15 at 13:41
  • Thank you! This is really interesting and much appreciated. I may be contacting you for further details. – whybird Jun 14 '15 at 00:24
  • 1
    Thanks for the explanation: the idea is indeed explicit in the last note. (incidentally, I haven't seen so much UPPER CASE in program output since about the early 1990s. I would recommend changing "95% confidence level" to "5% significance level" assuming that is what is meant.) – Nick Cox Jun 14 '15 at 13:37
  • 1
    Your wit is matched by your scholarship. Thanks for both . – IrishStat Jun 14 '15 at 13:41
2

I think that the title of the thread is misleading: You are not looking to compare density functions but you are actually looking for structural breaks in a time series. However, you do not specify whether these structural breaks are supposed to be found in a rolling time window or in hindsight by looking at the total history of the time series. In this sense your question is actually a duplicate to this: What method to detect structural breaks on time series?

As mentioned by Rob Hyndman in this link, R offers the strucchange package for this purpose. I played around with your data but I must say that the results are dissappointing [is the first data point really 4 or supposed to be 54?]:

raw = c(54,53,53,53,53,58,56,52,49,52,56,51,44,39,39,39,37,33,27,21,18,12,19,30,45,66,92,118,135,148,153,160,168,174,181,187,191,190,191,192,194,194,194,193,193,201,200,199,199,199,197,193,190,187,176,162,157,154,144,126,110,87,74,57,46,44,51,60,65,66,90,106,99,87,84,85,83,91,95,99,101,102,102,103,105,110,107,108,135,171,171,141,120,78,42,44,52,54,103,128,82,103,46,27,73,123,125,77,24,30,27,36,42,49,32,55,20,16,21,31,78,140,116,99,58,139,70,22,44,7,48,32,18,16,25,16,17,35,29,11,13,8,8,18,14,0,10,18,2,1,4,0,61,87,91,2,0,2,9,40,21,2,14,5,9,49,116,100,114,115,62,41,119,191,190,164,156,109,37,15,0,5,1,0,0,2,4,2,0,48,129,168,112,98,95,119,125,191,241,209,229,230,231,246,249,240,99,32,0,0,2,13,28,39,15,15,19,31,47,61,92,91,99,108,114,118,121,125,129,129,125,125,131,135,138,142,147,141,149,153,152,153,159,161,158,158,162,167,171,173,174,176,178,184,190,190,185,190,200,199,189,196,197,197,196,199,200,195,187,191,192,190,186,184,184,179,173,171,170,164,156,155,156,151,141,141,139,143,143,140,146,145,130,126,127,127,125,122,122,127,131,134,140,150,160,166,175,192,208,243,251,255,255,255,249,221,190,181,181,181,181,179,173,165,159,153,162,169,165,154,144,142,145,136,134,131,130,128,124,119,115,103,78,54,40,25,8,2,7,12,25,13,22,15,33,34,57,71,48,16,1,2,0,2,21,112,174,191,190,152,153,161,159,153,71,16,28,3,4,0,14,26,30,26,15,12,19,21,18,53,89,125,139,140,142,141,135,136,140,159,170,173,176,184,180,170,167,168,170,167,161,163,170,164,161,160,163,163,160,160,163,169,166,161,156,155,156,158,160,150,149,149,151,154,156,156,156,151,149,150,153,154,151,146,144,149,150,151,152,151,150,148,147,144,141,137,133,130,128,128,128,136,143,159,180,196,205,212,218,222,225,227,227,225,223,222,222,221,220,220,220,220,221,222,223,221,223,225,226,227,228,232,235,234,236,238,240,241,240,239,237,238,240,240,237,236,239,238,235)
raw = log(raw+1)
d = as.ts(raw,frequency = 12)
dd = ts.intersect(d = d, d1 = lag(d, -1),d2 = lag(d, -2),d3 = lag(d, -3),d4 = lag(d, -4),d5 = lag(d, -5),d6 = lag(d, -6),d7 = lag(d, -7),d8 = lag(d, -8),d9 = lag(d, -9),d10 = lag(d, -10),d11 = lag(d, -11),d12 = lag(d, -12))

(breakpoints(d ~d1 + d2+ d3+ d4+ d5+ d6+ d7+ d8+ d9+ d10+ d11+ d12, data = dd))
>Breakpoints at observation number:
>151 
>Corresponding to breakdates:
>163 

(breakpoints(d ~d1 + d2, data = dd))
>Breakpoints at observation number:
>95 178 
>Corresponding to breakdates:
>107 190 

I am not a regular user of the package. As you can see it depends on the model you fit on the data. You can experiment with

library(forecast)
auto.arima(raw)

which gives you the best fitting ARIMA model.

HOSS_JFL
  • 417
  • 3
  • 11
  • Thank you! I have edited out the word 'histogram' from the title; I had usud it incorrectly initially, and forgot to edit the title when I removed it from the body in an earlier edit in response to a comment. – whybird Jun 14 '15 at 00:06
  • My data is actually a series of spatially related data, it is not time-based and will usually not exist on a straight line or even in a plane often enough - but you are right that at some fundamental level it can be considered in the same way; I guess that may be part of why my earlier searches didn't find the answers I was expecting. – whybird Jun 14 '15 at 00:08
  • The first data point in that example is really a 4, but it could well be that we happened to hit the end of a previous structure or perhaps it was noise; I'd be happy to leave it out as an outlier, but whatever system I come up with will have to cope with things like that too. – whybird Jun 14 '15 at 00:10
  • Oh, and the analysis is in hindsight. I'll edit the question to clarify. – whybird Jun 14 '15 at 00:14
2

My interpretation of the question is that the OP is looking for methodologies that would fit the shape(s) of the examples provided, not the HAC residuals. In addition, automated routines that don't require significant human or analyst intervention are desired. Box-Jenkins may not be appropriate, despite their emphasis in this thread, since they do require substantial analyst involvement.

R modules exist for this type of non-moment based, pattern matching. Permutation distribution clustering is such a pattern matching technique developed by a Max Planck Institute scientist that meets the criteria you've outlined. Its application is to time series data, but it's not limited to that. Here's a citation for the R module that's been developed:

pdc: An R Package for Complexity-Based Clustering of Time Series by Andreas Brandmaier

In addition to PDC, there's the machine learning, iSax routine developed by Eamon Keogh at UC Irvine that's also worth comparison.

Finally, there's this paper on Data Smashing: Uncovering Lurking Order in Data by Chattopadhyay and Lipson. Beyond the clever title, there is a serious purpose at work. Here's the abstract: "From automatic speech recognition to discovering unusual stars, underlying almost all automated discovery tasks is the ability to compare and contrast data streams with each other, to identify connections and spot outliers. Despite the prevalence of data, however, automated methods are not keeping pace. A key bottleneck is that most data comparison algorithms today rely on a human expert to specify what ‘features’ of the data are relevant for comparison. Here, we propose a new principle for estimating the similarity between the sources of arbitrary data streams, using neither domain knowledge nor learning. We demonstrate the application of this principle to the analysis of data from a number of real-world challenging problems, including the disambiguation of electro-encephalograph patterns pertaining to epileptic seizures, detection of anomalous cardiac activity fromheart sound recordings and classification of astronomical objects from raw photometry. In all these cases and without access to any domain knowledge, we demonstrate performance on a par with the accuracy achieved by specialized algorithms and heuristics devised by domain experts. We suggest that data smashing principles may open the door to understanding increasingly complex observations, especially when experts do not know what to look for."

This approach goes way beyond curvilinear fit. It's worth checking out.

Mike Hunter
  • 9,682
  • 2
  • 20
  • 43
  • Thank you - you are correct that what I want is to find clusters automatically, without analyst intervention. For what I am wanting to do to work, I will need to break datasets of 5000-15000 data points into clusters that each conform well to simple formulae (including repetitive ones) without human intervention over groups of around 50000 such datasets in a timeframe tolerable by humans on domestic computer hardware. – whybird Jun 15 '15 at 23:22
  • As for which curve to fit to each cluster, once I have detected the boundaries by whatever means, it is simple enough I think to just try different models (sine wave, polynomial, exponential) and see which gives a better ordinary r^2. – whybird Jun 15 '15 at 23:26
  • @whybrid To me it sounds like you're skipping a step. In other words, you need to *cluster* the objects first, then apply the "models" and only then can you evaluate their performance. Also, r-Squares are only appropriate for OLS estimation procedures. You need to find (a) standardized metric that spans estimation routines. – Mike Hunter Jun 16 '15 at 16:47
  • I'm probably just not explaining myself properly. What I'm thinking is 1) find clusters, 2) find best fit polynomial, sine wave and exponential models for each cluster, and 3) choose whichever of those fits the data best, per cluster. – whybird Jun 17 '15 at 07:28
  • @MikeHunter, can you provide a reference for the iSax routine by Eamon Keogh? – Zhubarb Jun 17 '15 at 10:09
  • @zhubarb I browsed "Eamonn Keogh" and got this link with SAX reference. http://www.cs.ucr.edu/~eamonn/ – Mike Hunter Jun 17 '15 at 14:00
  • Thank you, I found this webpage as well, do you know which of the publications [here](http://www.cs.ucr.edu/~eamonn/selected_publications.htm) is the one you are referring to? – Zhubarb Jun 17 '15 at 14:05
  • @zhubarb "SAX is the best representation for most time series problems" – Mike Hunter Jun 17 '15 at 14:09
  • 2
    OK, I think the miscommunication arises from this: Sax and iSax are representations formats for storing and processing time series, they are not clustering or segment/pattern detection algorithms (per OP's post). My understanding from your answer was that Keogh had come up with an algorithm that is based on the SAX representation format and happens to address the OP's problem. But I think this is not what you meant? – Zhubarb Jun 17 '15 at 14:12
  • @zhubarb My understanding was that it was a "clustering" or pattern-matching algorithm. I suggest you reach out to Keogh directly for further clarification. I am unable to provide anything more on this subject. If you do clarify the routine, would you mind posting a comment about it here? – Mike Hunter Jun 17 '15 at 14:22
  • 2
    OK, no need to reach out to Keogh, I know about [iSax](http://www.cs.ucr.edu/~eamonn/iSAX/iSAX.html) and [Sax](http://www.cs.ucr.edu/~eamonn/SAX.htm), they are representation formats for efficient mining of time series. The links explain them. iSax is the newer version. I was excited by my misunderstanding of your answer, hence the questions (not trying to be pedantic) :) . – Zhubarb Jun 17 '15 at 14:24
  • @zhubarb Thanks for the clarification. It would have saved a lot of wasted back and forth if you had simply put your cards on the table from the get-go. – Mike Hunter Jun 17 '15 at 14:53
  • 2
    i wasn't trying to conceal anything, i interpreted 'isax routine' as an algorithm operating on isax. I suggest your answer needs re-wording / modification after the clarification. – Zhubarb Jun 17 '15 at 14:57