7

The problem I'm trying to solve is to algorithmically figure out whether two curves converge or diverge in a graph (visually the problem is almost trivial). For examples:

converge diverge

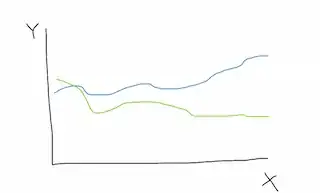
The left one is convergence, and the right is divergence. Note that the in both cases, the two curves may or may not have intersection(s), though in the examples above the intersections helps illustrate the problem visually.

EDIT - Thanks to @JonathanLisic helpful comments, here I attempt to refine the notion of convergence and divergence. By convergence, I intend to mean that the the difference in Y between the two curves decreases as X increases, and the two curves intersect at least once, and after the first intersection, the difference in Y remain small (so they either intersect a few more times or remain disconnected with some small difference(s) in Y (being parallel would be a special case to this)). Conversely, by divergence, I intend to mean that the difference in Y between the two curves increases as X increases, and the two curves do not intersect except possibly at the beginning. Again, becoming parallel beyond some X is a special case.

A possible solution is to first calculate the absolute values of the differences between the two curves, and fit a curve/function with the differences. For example, I can try to fit a straight line to the differences data, and if the slope is negative then I may conclude that the two curves converge. Otherwise, they may be diverging.

However, I realize that fitting a straight line may be very crude, as the difference may get smaller and then larger over the range of x-axis, or vice versa.

So what would be an ideal approach for curve fitting here?

skyork
  • 281
  • 1
  • 4
  • Can you define converge and diverge in a slightly less visual sense, and what the properties of these curves are? Remember convergence is defined as one object becoming another object in some sense such as the convergence of a sequence of values to another value, or convergence in distribution of a random variable to another random variable. – Jonathan Lisic Jun 09 '15 at 02:55
  • @JonathanLisic, thanks for the comments. I agree that the use of the terms 'convergence' or 'divergence' here may not be entirely appropriate. I think for convergence it can be seen as the difference in `y` for the same `x` decreases as `x` increases, perhaps to the extent that two curves intersect (and the difference after intersection(s) remains small?). Conversely, divergence can be seen as the difference in `y` for the same `x` increases as `x` increases. – skyork Jun 09 '15 at 03:38
  • 2
    I think you really need to flesh out what convergence means, in explicit language. If two things cross and remain close they can be parallel for a sufficiently small difference between each other, you could also have to coincident vertical lines, they clearly converge to each other, but diverge in several definitions of convergence. Is anything here random? – Jonathan Lisic Jun 09 '15 at 10:35
  • @JonathanLisic, the case of coincident vertical lines is extreme, and given the nature of my data, we don't need to worry about it as it simply won't happen. I acknowledge the (still small) possibility that two curves intersect but then remain parallel with a small difference in between. In this case, I would still consider the two curves converge, so the definition of convergence may be refined to: the two curves intersect at least once and the difference remain "sufficiently small" after the first intersection. However, I struggle to define the "sufficiently small" part. Any suggestion? – skyork Jun 09 '15 at 18:58
  • 2
    I'm still not happy with the definition; maybe a better statement would be along the lines of testing that the difference between two 'lines' are decreasing over a fixed interval. So what is generating these 'lines'? – Jonathan Lisic Jun 09 '15 at 19:29
  • @JonathanLisic, good point, the range of `X` is fixed and the same for every graph. Do you think that would help come up a more 'satisfactory' definition? The data come from usage stats of a website, if that makes a difference. – skyork Jun 09 '15 at 21:09
  • Let us [continue this discussion in chat](http://chat.stackexchange.com/rooms/24640/discussion-between-jonathan-lisic-and-skyork). – Jonathan Lisic Jun 09 '15 at 21:33
  • If the goal is to *classify* each pair of curves as converging or diverging, then one option would be to divide the data along the x-axis into (say) 3 equal-width portions, then calculate the mean difference in the first third (small x) and the last third (large x). You say the range of X is fixed, so this should be consistent. I don't see the need to fit any curves... – dcorney Aug 05 '15 at 16:41
  • Why do they have to cross ? There may be asymptotic convergence (e.g. 1/x if x>0) – user89073 Nov 19 '15 at 15:42
  • What are the "curves" and precisely how are they given to you as data? – whuber Mar 13 '16 at 22:22

0 Answers0