1

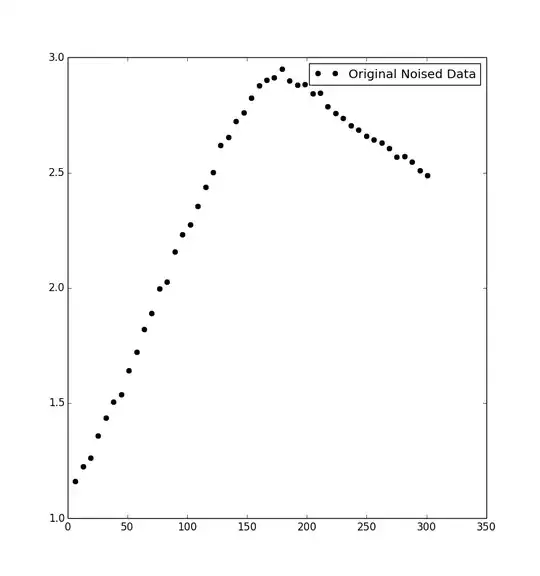
I have data that looks somewhat like the following plot (and dataset). It's been suggested that a double exponential (e.g. k (exp(−αt) − exp(−βt))) might fit it, but I can seem to get it to fit (using numpy).

It looked to me like the data descends too quickly to be modeled by the double exponential.

So, my question is can a double exponential model this? What equation might better model the data? Any other advise is most welcome.

data

x-coordinates:   1.0   6.4  12.8  19.2  25.6  32.0  38.4  44.8  51.2  57.6  64.0  70.4  76.8  83.2  89.6  96.0 102.4 108.8 115.2 121.6 128.0 134.4 140.8 147.2 153.6 160.0 166.4 172.8 179.2 185.6 192.0 198.4 204.8 211.2 217.6 224.0 230.4 236.8 243.2 249.6 256.0 262.4 268.8 275.2 281.6 288.0 294.4 300.8
y-coordinates:  1.11480 1.16038 1.22538 1.26349 1.36004 1.43608 1.50585 1.53842 1.64206 1.72283 1.82148 1.89048 1.99732 2.02578 2.15737 2.23078 2.27603 2.35556 2.43753 2.50104 2.61819 2.65381 2.72461 2.76175 2.82420 2.87889 2.90351 2.91266 2.94975 2.89997 2.88127 2.88341 2.84234 2.84720 2.78705 2.75804 2.73560 2.70544 2.68594 2.65800 2.64314 2.62951 2.60664 2.56948 2.57086 2.54823 2.50936 2.48867

Original data is here: http://pastebin.com/0x641He3

whuber
  • 281,159
  • 54
  • 637
  • 1,101
new299
  • 181
  • 2
  • Thank you. Could you explain what these data *mean*? Knowledge of that can suggest appropriate formulas. As examples of how this works I offer two analyses of mine, http://stats.stackexchange.com/a/64039 and http://stats.stackexchange.com/a/148166. What you might find relevant about the second is how it begins with a piecewise linear theoretical model and, by means of an analysis of sources of variation, derives a curvilinear model from it. Your situation looks remarkably similar: the underlying curve might be just a broken line segment. (The code there gives a good fit to your data!) – whuber Jun 05 '15 at 21:37
  • @whuber It's a physical phenomenon. But as an analogy I might say it's the number of people holding on to a climbing frame. When the frame is empty, people want to join. However it seems with time they fall off or get tired. I don't know if that behavior is linear or exponential however. But specifically I've been suggested a double exponential for this data. And I'm wondering if it's just not possible to fit that well, or if I've selected poor initial parameters (or made some other error). – new299 Jun 05 '15 at 21:54
  • 1
    A double exponential won't come remotely close. Whether or not my energy usage model is meaningful here, it fits all your data to within $\pm 0.06$, which is remarkably good ($R^2=0.998$). This is because it is a flexible way to model any broken line (a vee shape) that appears to be faired smoothly around the vertex. From it one can go further and identify decreased residual variation along the right hand limb and a tiny bit of near-sinuosidal curvilinearity along the left hand limb. The estimated peak is at $(163.1, 2.974)$ and the two slope estimates are $0.01167$ and $-0.003482$. – whuber Jun 05 '15 at 22:04
  • If this question is still open, I can fit the data to a few hundred known, named equations and report the top five or ten results. However, this is effectively similar to fitting with a spline in that the results are empirical models only. The results may suggest a line of thinking towards a mechanistic model, but will effectively be empirical models only. James –  Aug 26 '15 at 00:08
  • Are the x's observed without error? Are the y's necessarily positive? – Glen_b Aug 26 '15 at 01:09
  • Also note that in a number of physical phenomena, one side of a curve is dominated by one dynamic, and the other by another dynamic, so it is really two curves stapled (or glued, smushed?) together. – mandata Aug 26 '15 at 01:41

0 Answers0