3

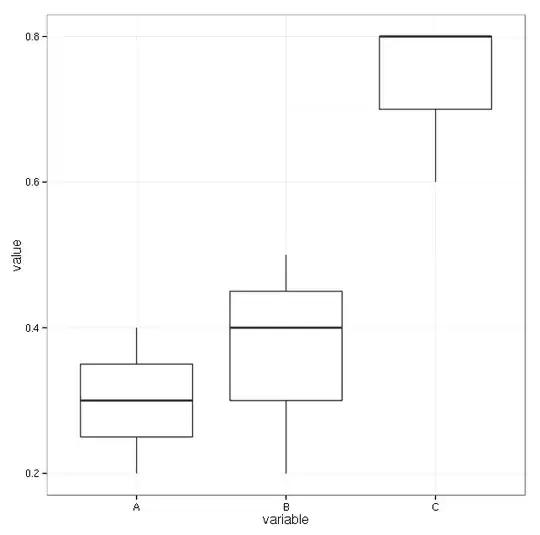
I have a problem in medicine: Each patient can have several (3) symptoms (A,B,C) of a disease at the same time. For each symptomtype we can measure a score i.e. A=0.2, B=0.45, C=0.8. The aim is that we want to conclude from the value of the score to what kind of symptom (A,B,C) the measured value belongs. So my test hypothesis is that the means of A,B,C are not different and my alternative is that they are ordered A < B < C.

Here is my table:

PatientId, A, B, C
1, 0.2, 0.5, 0.8
2, 0.3, 0.4, 0.6 
3, 0.4, 0.2, NA
4, ...

My idea is to use a paired T-test, which I am not sure about and leads me to the following 2 problems:

  1. I would need two t-tests, one for comparing the means of A and B and one for B and C. So I would get also two p-values, but I would prefer to have everything in one test an get only one p value, if there is a possibility.

  2. I have missing Values in my table, cause not every patient has all 3 sypmtoms. How do I handle them?

So my questions are if my idea (paired t-tests) is correct, how to handle the two issues above or if it is not correct. What would then be a better idea?

gung - Reinstate Monica
  • 132,789
  • 81
  • 357
  • 650
Taz
  • 318
  • 2
  • 8
  • See https://stats.stackexchange.com/questions/169419/why-bother-looking-at-an-omnibus-anova-when-i-have-a-priori-hypotheses-about-gro/169452#169452 – kjetil b halvorsen May 11 '21 at 15:57

3 Answers3

3

[I harbor some doubts about the situation you describe; it doesn't sound to me like hypothesis tests are really the tool that do what you seem to be discussing. However, I'll answer the question as it stands.]

There are a number of ways of testing against ordered alternatives in a single test. They tend to be more powerful than tests not designed against the specific alternative of interest.

For the case where you have matched observations by patient, one such is Page's test, a nonparametric test. An alternative is a match test.

Page's test is available in many statistics packages.

The Page test is discussed in Wikipedia here.

Similar to a Friedman test, the data are ranked within each block (row, patient), and then the rank sums for each column (symptom) are multiplied by the column index $L=\sum_i iR_i$, where $R_i=\sum_j r_{ij}$, where $r_{ij}$ is the rank of the $j$th symptom in the $i$th patient. In small samples an exact null distribution can be computed, and there's a large sample normal approximation.

The match test for ordered alternatives in related samples was developed by Neave and Worthington (1988). It's based on the same ranking scheme but the test statistic counts 1 every time that the rank matches the expected rank under the alternative (i.e. when $r_{ij}=i$). It also counts $\frac12$ when the rank is 1 away from expected ("partial match"), or in the presence of ties, when $0.5 \leq |r_{ij} - i | \leq 1.5$. Again, in small samples an exact null distribution can be computed, and there's a large sample normal approximation.

The large sample normal approximations for both tests are discussed here


There are a variety of parametric approaches that will have more power when the parametric assumptions are true, but they tend to be substantially more complicated. Another alternative is to use a permutation test (or other resampling=based test, such as a bootstrap test) on a parametric-test-based statistic.

Glen_b
  • 257,508
  • 32
  • 553
  • 939
  • 1
    Page test and match test are interesting and fit the situation. But if anova followed by pairwise t-tests shows the groups are different and the means of the groups are in that order, will that not be sufficient statistical evidence of significance? – rnso Jun 06 '15 at 01:09
  • @rnso Certainly I'd regard that as supporting the hypothesized ordering against the null of equal means. My point was that this approach has lower power. It's like collecting a nice sized sample and then ignoring most of your data. So while, *yes*, you can still show it that way, a lot of the time you won't show what you could have. By focusing on the specific effect in the alternative, you can on average pick up smaller deviations that way. – Glen_b Jun 06 '15 at 01:16
0

I would say that your idea is correct.

If you want to perform all in just one test. I suggest that you can categorise the score in an appropriate way, and use the Chi-squared test.

Metariat
  • 2,376
  • 4
  • 21
  • 41
  • Categorizing continuous variables is generally not a good approach: http://biostat.mc.vanderbilt.edu/wiki/Main/CatContinuous – rnso Jun 05 '15 at 16:56
0

You can arrange your data as:

  PatientId variable value
1         1        A   0.2
2         2        A   0.3
3         3        A   0.4
4         1        B   0.5
5         2        B   0.4
6         3        B   0.2
7         1        C   0.8
8         2        C   0.6
9         3        C   0.8

and calculate means and sd:

> aggregate(value~variable, mm, mean)
  variable     value
1        A 0.3000000
2        B 0.3666667
3        C 0.7333333
> aggregate(value~variable, mm, sd)
  variable     value
1        A 0.1000000
2        B 0.1527525
3        C 0.1154701

and perform anova to see if the difference is significant. An error code will be needed since patients are common to different symptoms:

> summary(aov(value~variable+Error(PatientId/variable), mm))

Error: PatientId
          Df   Sum Sq  Mean Sq F value Pr(>F)
Residuals  1 0.001667 0.001667               

Error: PatientId:variable
         Df Sum Sq Mean Sq
variable  2 0.2862  0.1431

Error: Within
          Df  Sum Sq Mean Sq F value Pr(>F)  
variable   2 0.10381 0.05190   5.496 0.0993 .
Residuals  3 0.02833 0.00944                 
---
Signif. codes:  0 ‘***’ 0.001 ‘**’ 0.01 ‘*’ 0.05 ‘.’ 0.1 ‘ ’ 1

and do pairwise t-tests to find the differences:

> pairwise.t.test(mm$value, mm$variable)

        Pairwise comparisons using t tests with pooled SD 

data:  mm$value and mm$variable 

  A     B    
B 0.537 -    
C 0.016 0.023

P value adjustment method: holm 

Following graph will show the distribution:

enter image description here

Hope this is of some help.

rnso
  • 8,893
  • 14
  • 50
  • 94