5

Following are 2 plots, one of lasso using glmnet package and other 2 from randomForest (variable importance) of the mtcars data set assessing variable mpg vs others. In the lasso plot, the blue and red lines indicate lambda.min and lambda.1se, respectively.

enter image description here enter image description here

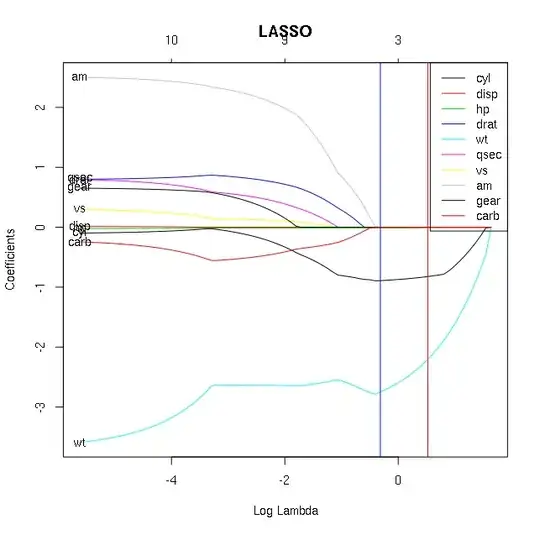
The randomForest plot gives high importance to disp and hp, which are close to 0 almost throughout the plot. Also am is of lowest importance in randomForest, though it has relatively high value in lasso plot.

What could be the reason for these discrepancies? Which one should one accept while determining important predictors of mpg in this dataset?

Edit: Both above plots was without scaling. Following are the plot after all variables (including mpg, the outcome variable) are scaled.

enter image description here enter image description here

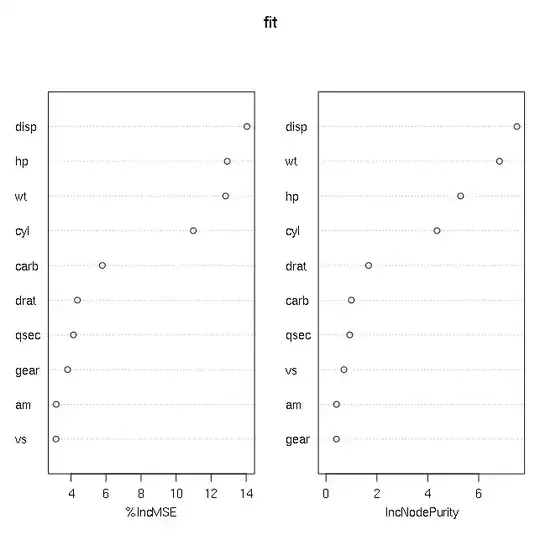
These plots are much more similar (wt, hp, cyl). But disp is still discrepant. It is highest in randomForest but very small in lasso plot.

rnso
  • 8,893
  • 14
  • 50
  • 94
  • 1
    Did you standardize the variables? Random forest also takes into account interaction effects depending on the depth of the tree. – spdrnl Jun 02 '15 at 17:54
  • @rnso Seconding spdrnl's comment. I'm very interested in whether the glmnet plot is on the standardized scale. It's be worth repeating the experiment after manually standardizing all the predictors. – Matthew Drury Jun 02 '15 at 18:05
  • I had a moment's downtime and did a small experiment. The glmnet coefficient plot is *not* on the standardized scale, pre-standardizing changes the scale of the plot. – Matthew Drury Jun 02 '15 at 18:22
  • 1
    You should also standardize the binary variables here for a fair comparison between coefficients. – shadowtalker Jun 02 '15 at 18:42
  • 2
    The two results look remarkably similar. They both make exactly the same division into high- and low-importance variables and even rank them almost the same. Could you explain why you expect two completely different procedures to produce *identical* results on *completely different scales*? – whuber Jun 02 '15 at 18:43
  • @whuber am I misreading these charts? `disp` and `hp` are shrunken to zero in the lasso model but are two of the most important in the random forest model. – shadowtalker Jun 02 '15 at 18:50
  • @ssde I may have misunderstood the graphics: I took the left hand dot plot to be an analysis of the LASSO results, where `disp` and `hp` are among the three highest (rightmost) values. I paid no attention to the LASSO lines because the meaning of "coefficient" is ambiguous, as remarked by spdrnl in the first comment and confirmed by Matthew Drury. It now seems more likely to me that the bottom plots are both for the random forest model, in which case all I can conclude is that there isn't enough information in the post to compare the results. – whuber Jun 02 '15 at 18:57
  • My original plots were with unscaled, unstandardized data. I have added the lasso plot obtained with all variables scaled above using scale() function in R. This plot is similar to those of randomForest. The hp, cyl and wt variables are important, though disp is important in randomForest but not in lasso analysis. – rnso Jun 03 '15 at 00:39

1 Answers1

8

This could be because you're measuring two different things. The lasso coefficients are essentially effect sizes, and shrinkage helps distinguish "zero" effects from "nonzero" effects. Importance of a variable in the random forest model measures the improvement in predictive accuracy due to including that variable.

So you're comparing apples and oranges. A fair comparison would be to re-fit both models without each variable, and compute the decrease in MSE (i.e. with cross-validation or a train/test split) due to omitting each variable. Or instead of dropping each predictor you could randomly permute it; this how %IndMSE is computed.

This procedure should be invariant to input scaling, but you should usually scale and center your inputs anyway. It helps with numerical stability, convergence in iterative algorithms, inverting matrices, and most of all interpretability.

shadowtalker
  • 11,395
  • 3
  • 49
  • 109