when some of your coefficients in multivariate logistic regression model is negative while i know these variable have positive sign in univariate model, What should I do؟
Asked
Active
Viewed 371 times
1
-
Welcome to the site! Could you describe what you mean by "univariate model"? And maybe describe the results you're getting in a little more detail. – smillig May 29 '15 at 08:49
-
This question is also answered at http://stats.stackexchange.com/questions/41633 (for general regression). – whuber Jun 04 '15 at 16:49
2 Answers
2
This is a general phenomena caused by correlation between your independent variables. Here's a small example I constructed for you to experiment with. I demonstrated with a linear regression as the phenomena is easier to see pictorially in this case, but it also happens with any generalized linear model, including logistic regressions.
First, let's create a vector of random uniform values
x_1 <- runif(200, 0, 1)
and then construct another vector that is explicitly correlated with x_1
x_2 <- .5*x_1 + rnorm(200, 0, .25)
Since I forced a statstical dependency between x_1 and x_2, these random variables are correlated
cor(matrix(c(x_1, x_2), ncol=2))
          [,1]      [,2]
[1,] 1.0000000 0.5059403
[2,] 0.5059403 1.0000000
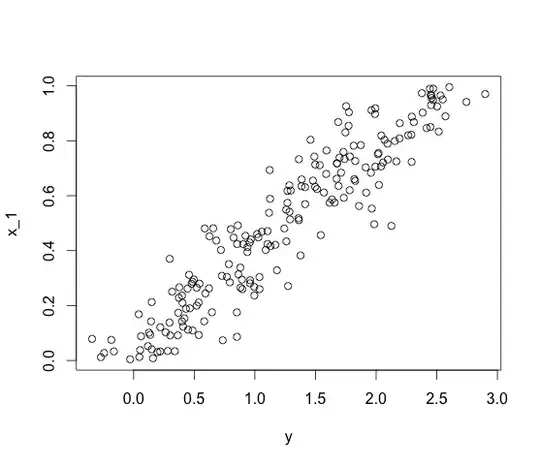
You can see this geometrically with a scatterplot
Now let's make a dependent variable that depends on both
y <- 3*x_1 - x_2 + rnorm(200, 0, .1)
This collection of three variables show the behavior that you are witnessing. Putting x_2 in a univariate model shows a positive coefficient
df <- data.frame(x_1=x_1, x_2=x_2, y=y)

# Univariate model
lm(y~x_2, data=df)

Call:
lm(formula = y ~ x_2, data = df)

Coefficients:
(Intercept)          x_2
     1.1152       0.5061
In fact, you can see that both x_1 and x_2 are positively correlated with y in a picture
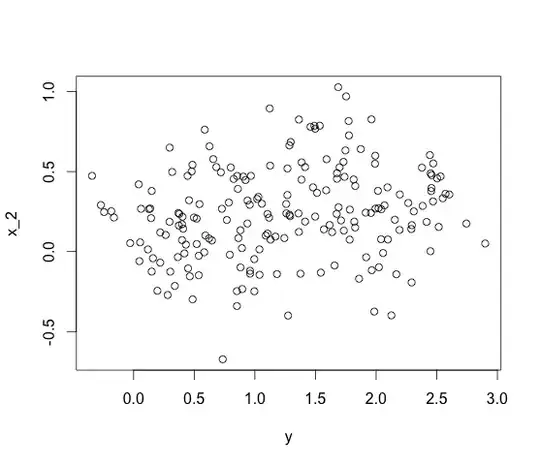
But if I put them all together, I get recover the true negative coefficient for x_2!
# Multivariate model
lm(y ~ x_1 + x_2, data=df)

Call:
lm(formula = y ~ x_1 + x_2, data = df)

Coefficients:
(Intercept)          x_1          x_2
   -0.01096      3.00800     -1.00790
Matthew Drury
- 33,314
- 2
- 101
- 132
0
The most common reason is that the remaining variables of the fitted model influence the changing of the sign!
Metariat
- 2,376
- 4
- 21
- 41