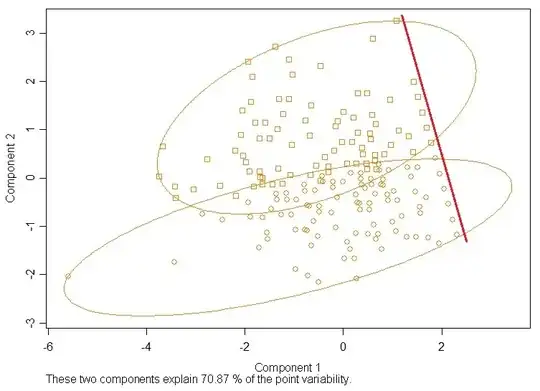
I ran a clustering and in the resultant PCA score plot some observations getting in a line drew my attention (I marked them with a red line) . How come they distribute like that? I doubt there is something wrong with the data. What can I do with the data?
Asked
Active
Viewed 151 times
2
James
- 21
- 1
-
3It looks as if your data were right-censored. Clustering has nothing to to with it. [This question](http://stats.stackexchange.com/q/33165/3277), thought not exactly same, was instructive. – ttnphns May 24 '15 at 18:43
-
Any chance these are **0 values in one of the attributes**? Without PCA, it would probably be easier to interpret. – Has QUIT--Anony-Mousse May 25 '15 at 14:55
-
There is no 0 value in the attributes. – Jul 21 '15 at 19:21