4

I am testing this model in SPSS AMOS.

AMOS picture

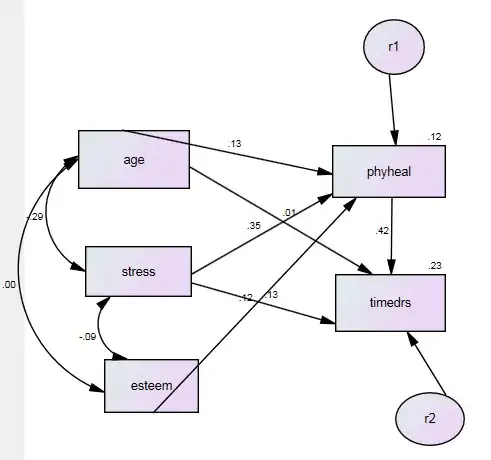
The value of .23 above the top right corner of timedrs is the squared multiple correlation for that variable.

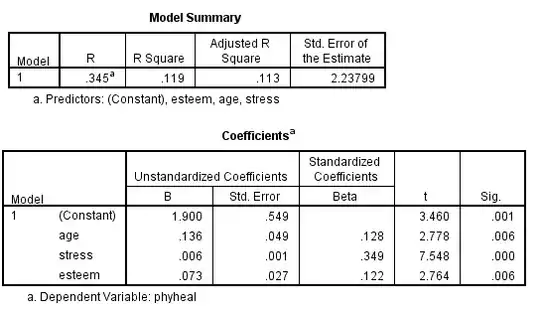
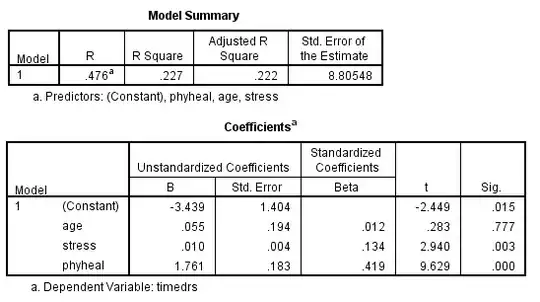
I also ran the same analysis as two multi-step regressions. The results came out like this:

enter image description here enter image description here

The generalized squared multiple correlation is described by Schumacker & Lomax (2004) on p159 as a "traditional non-SEM path model-fit [index]." The relevant text is as follows:

Schumacker & Lomax p159

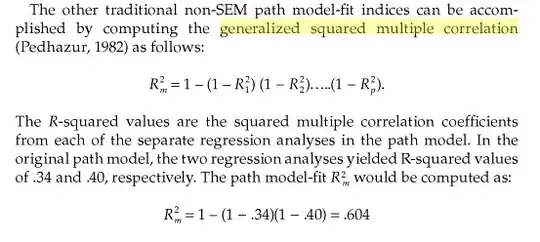
Applying the formula for a generalized squared multiple correlation, I get:

1 – (1 - .119) × ( 1 - .227) = 0.32.

This is higher than the .23 I obtained from the path analysis run in AMOS, and from the equation I can see that it can never be lower than the smallest value of R Square that goes into its calculation. I understand that I should not be surprised that the values are not the same. However, I am unsure about how to interpret the generalized squared multiple correlation, i.e. this $R^2m$ thing. What would a high/low generalized squared multiple correlation mean? Is it a good method of assessing model fit?

Schumacker, R. E., & Lomax, R. G. (2004). A beginner's guide to structural equation modeling. Psychology Press.

  • 2
    What's the generalized R²? I've never heard of this, but I'm very surprised to see you combine two R² from analyses that use different dependent variables. – Patrick Coulombe May 24 '15 at 05:16
  • 1
    Thanks for the question. I guess this concept is not as common as I realised. I've edited the OP to clarify this point. – user1205901 - Reinstate Monica May 24 '15 at 06:01
  • 1
    Interesting problem. Could you show the relevant AMOS output where the R² is being reported? Some output titles/columns/rows/notes/etc. might help figure it out... – Patrick Coulombe May 24 '15 at 06:04
  • 1
    I've put the AMOS Estimates Output at http://i.imgur.com/yhYFmf7.png. The R Square estimates are the same as those I obtained from the regression function in SPSS. I'm not entirely sure this was the output you were seeking, so please let me know if there's something out from AMOS I should post. – user1205901 - Reinstate Monica May 24 '15 at 07:20
  • 2
    But you said AMOS reported some sort of overall R² as .23? I don't see that in your output. All I see are the two R², one for each DV, which correspond exactly to the ones you obtained through SPSS. – Patrick Coulombe May 24 '15 at 15:35
  • 1
    The value of .23 above the *timedrs* is the squared multiple correlation for that variable. I've edited the OP to make that clearer. Sorry, I thought this was a general SEM convention, but perhaps putting that value at the top right of the box is just some AMOS convention. – user1205901 - Reinstate Monica May 25 '15 at 01:25
  • 1
    0.23 is the R2_1 for the regression where timedrs is the dependent variable. You are then using that value, along with R2_2 = 0.12 to calculate R2_m. R2_m will not be equal to R2_1, which seems to be what you expect? Your calculation is correct, I just think you are a bit confused on what R2m is. – D L Dahly Jun 03 '15 at 10:51
  • 1
    Thanks for your feedback. I've edited the question to make it clearer that that's what I'm confused about. – user1205901 - Reinstate Monica Jun 05 '15 at 07:49
  • 1
    generalized squared multiple correlation is R square. See https://www.youtube.com/watch?v=3KHULVuCSh0 – yfmsu2016 Sep 28 '15 at 18:27

2 Answers2

3

Although as far as I can tell the 3rd edition of Schumacker & Lomax doesn't answer my question, the 4th edition (from 2015) does! Quoting p84 of that text (but changing the figure to match my data), the answer to the question is:

"The $R^2m$ for the path model would suggest that [32%] of the variance in [timedrs] is explained by the relations in the path model."

I'd still welcome further explanation of how this should be interpreted, but I'll take this as a good enough answer for now.

1

You're making a serious mistake by using estimation shown. You're pointing path model on graph, which can not be done in the SPSS, and SPSS output instead of AMOS output. The SPSS for which you specify showed tables can not execute the path-model as You showed, a simple regression or even multiple regressions outpu can not be combined in this way.

In addition, using a multiple regression adjusted R-squared instead of the usual R-squared to the percentage of the explained variance.

The rest of the discussion here does not make sense.

statistic24h
  • 21
  • 1
  • 4