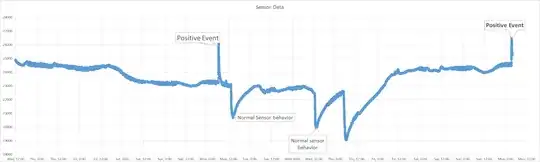
I worked on a similar problem a few weeks ago to detect the right peaks in a noisy sensor.
The most important task here is to select the right features. Slope seems like a good idea, maybe not using neighboring points but data points separated by a fixed distance (say 10 or 100, depending on your sample rate).
If it's crucial to you to use machine learning tools, I would suggest to build a training set which you can use to train supervised models like Multilayer Perceptrons (neural network), SVM and so on. The training data needs to be labelled to be able to train supervised models. Here is what I did:
Building the data set
I found the approximate starting position of the signal I wanted to detect (in your case the first few data points inside the peak). Let's say they are at x_10, x_30 and x_53. I would then build a dataset where I select a few of the neighbor points, which would result in the dataset looking like this:
x_{8}, x_{9}, x_{10}, x_{11}, x_{12}
x_{28}, x_{29}, x_{30}, x_{31}, x_{32}
x_{51}, x_{52}, x_{53}, x_{54}, x_{55}
furthermore I would select a few random points in the data where I know there is no desired signal and would add those data to the dataset, let's say those observations are at x_14 and x_41. The final dataset would then look like this:
x_{8}, x_{9}, x_{10}, x_{11}, x_{12}
x_{28}, x_{29}, x_{30}, x_{31}, x_{32}
x_{51}, x_{52}, x_{53}, x_{54}, x_{55}
x_{12}, x_{13}, x_{14}, x_{15}, x_{16}
x_{39}, x_{40}, x_{41}, x_{42}, x_{43}
The corresponding label vector, telling the model the category of my data would then look like this:
[ 1, 1, 1, 0, 0 ]
which means that the first 3 rows belong to class 1 (desired) and the last two rows to class 0 (undesired).
I then put my data into a Multilayer Perceptron with 3 layers (1 input, 1 hidden, 1 output) (with sigmoid-functions for non-linearity). That worked surprisingly well for me.
Abandoning machine learning
Though the MLP worked fine, I ended up with solving my problem by a few if-else rules using more powerful features like local variance, absolute value of the signal and a few more. The thresholds were manually tuned (because it was easier than building a large training dataset).
I would hence suggest to try simple rules and try different features. From the graphics you posted it seems that the signal is very clear and hence tuning the thresholds is not super crucial if you have good features.
A few ideas:
- Slope (e.g. x_{i} - x_{i-T} where T > 0)
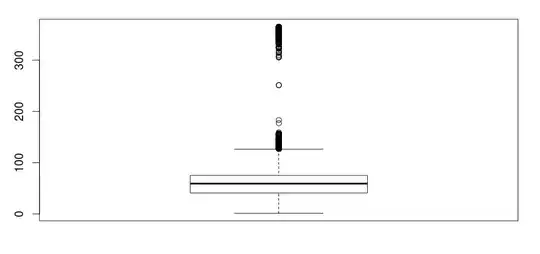
- Large deviation from the local mean (test for x_{i} > Average(x_{i-T},...,x_{i-1}) + a*StandardDeviation(x_{i-T},...,x_{i-1}), where a could be 3 or higher, depending on how clear/extreme the peaks are)
- Value of x_{i} (if the value in the peaks are the same in every peak. Doesn't seem to be the case in your example)