If your primary interest is in the differences between Condition 1 and Condition 2, you certainly should examine within-individual paired differences between Conditions rather than overall means. If you don't consider the individuals, the variances of $\mu_1$ and $\mu_2$ will include the inter-individual differences in baseline gene expression, so your ability to detect a difference between $\mu_2$ and $\mu_1$ will be compromised. And with tissue from the same individuals facing both Conditions, it can be argued that the assumption of independent observations underlying standard statistical tests are not met if you disregard the individuals.
You probably don't need to set up a formal mixed model beyond such paired analyses, unless you have an interest in some type of inter-individual difference per se. In principle a mixed model could address issues like inter-individual differences in gene expression among the brain regions, or inter-individual differences in Condition effects among brain regions, but with only 11 individuals you have little statistical power for such analyses. If your studies were done on brains of typical inbred laboratory mice, such inter-individual differences would generally be of little intrinsic interest in any event.
For data exploration and for publication, you should consider plots like those shown on this page, in its discussion of paired data, for displaying your results in ways that show inter-individual differences both in baseline expression (say, Condition 1) and in treatment responses (Condition 2 minus Condition 1). These can often be more informative than a simple table of statistical results.
Added in response to comments:
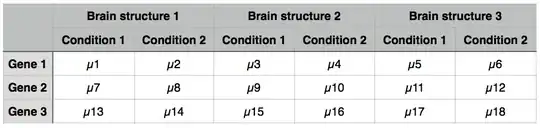
Since you want to compare gene-expression ratios among brain structues, e.g., $\mu_2/\mu_1$, $\mu_4/\mu_3$, and $\mu_6/\mu_5$, there are two good reasons to do your statistical analyses in a log-expression scale.
First, gene-expression data tend to have measurement errors proportional to the gene expression value. In PCR, for example, errors tend to be fairly constant in the original $C_t$ (cycles-to-threshold) scale. With every one extra unit in $C_t$ representing half as much gene expression, the errors in the absolute-expression scale are thus proportional to the level of expression. But typical statistical tests require that variances be the same among the items being compared.
Taking log-expression values (depending on PCR quality and how you normalize, often as simple as just using -$C_t$ values) puts you in a scale where variances in measurements will tend to be independent of the mean value. Similarly, you will note that microarray gene measurements are typically reported in $log_2$ scales.
Second, ratios can have poor behavior in terms of variance. In the log scale, the ratio $\mu_2/\mu_1$ is simply the difference $log(\mu_2) - log(\mu_1)$, each of which has a well defined variance.
Analysis that takes the individuals into account will help correct for any systematic differences among the individuals in terms of their tissues' relative responses to the two conditions. Think of this analysis as an extension of the paired t-test, which is typically very helpful in biological experiments. Any estimate of the inter-individual variance produced by a mixed model will not be very precise with only 11 individuals, as your recognize, but if you choose to account for individuals in that way you don't need to interpret that result of the analysis.
So I recommend that you present to your analysis the difference in log-scaled expression values between Condition 2 and Condition 1 for each individual in each region. Analyze those data for differences among regions, with the individuals taken as repeated measures.