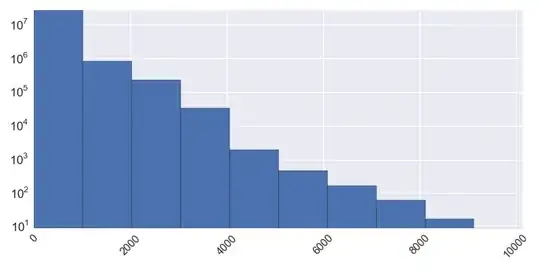
The first thing that could be noticed about your data is that there is a strange and sharp drop in the values below the 38.88 value. This looks like the data was truncated, i.e. "something" happen that the values above this value were not observed in your sample. If it was so, then using estimates from your data would give you biased (shifted to the left) estimates about the population. Consider the example below, where I generated some data with known $\mu$ and $\sigma^2$, from Normal distribution truncated at some point U, so that it resembles your data. Next I computed maximum likelihood estimate of truncated Normal distributions for $\mu$ and $\sigma^2$. As you can see, the ML estimates have better fit then the mean and sd estimated on the sample data.
set.seed(123)

U <- 37
x <- rnorm(500, 30, 5)
x <- x[x < U]

library(truncnorm)

llik <- function(param) -sum(log(dtruncnorm(x, mean=param[1], sd=param[2], b=U)))
optim(par=c(1, 1), llik, method = "L-BFGS-B", lower=c(1,1), upper=c(100, 100))
This however assumes that the distribution of your data is truncated. If it is not truncated and little is known about the distribution, then I would use bootstrap for constructing intervals as it does not have any distributional assumptions.