I've gone through the 70+ questions when using "survival no censoring" as my search criteria, but I can't seem to find an answer to this very simple situation.
I have patients' length of stay in a hospital and I want to know if the patients who tested positive for a certain bacteria stayed longer in hospital compared to those who didn't test positive.
A simple, straight-forward way of doing this using the sample data below would be to do make a simple plot.
Simple box plot
plot(df$test, df$Length_of_stay)
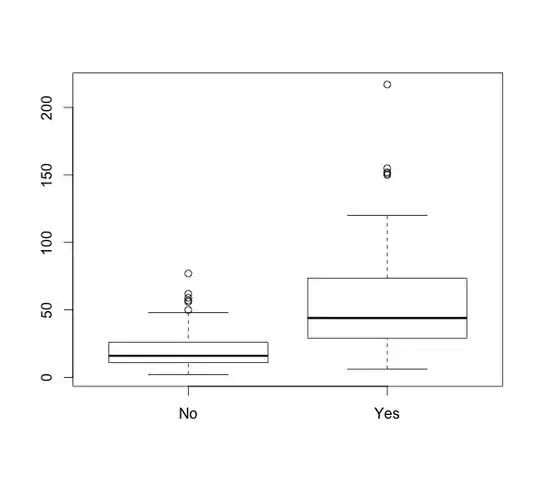
This shows us an obvious difference in length of stay. You could then compare these two using either a t.test after log-transformation (the data distribution of length of stay looks poissony) or a Wilcoxon-rank-sum, which I personally would prefer to do in this situation.
But now I could also have a look at the differences of length of stay using a time-line and as such, I think of a Kaplan-Meier curve.
Kaplan-Meier Curve
km <- survfit(Surv(Length_of_stay)~test, data=df)
plot(km)
Which gives me this really nice looking plot.
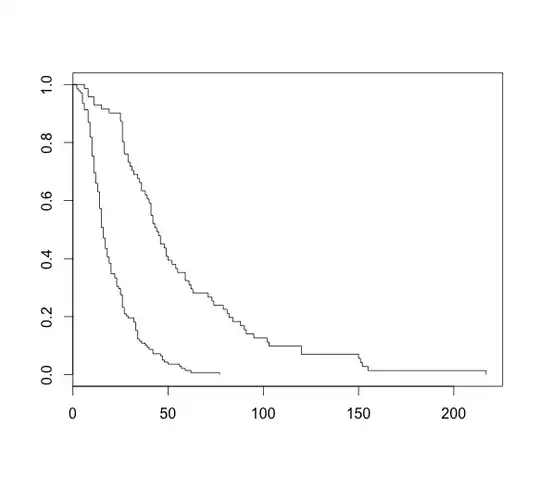
But I have no censoring included. The problem is, every patient gets discharged. Thus, if I were to take "discharge" as an event, everyone would equal 1.
In the help(Surv) it says
Although unusual, the event indicator can be omitted, in which case all subjects are assumed to have an event.
Which kind of applies to this situation.
So now my questions are:
a) am I taking it too far with KM-curve and should I simply stick with the simple boxplots and comparison of rank of sums (or similar)?
b) is the survival object even valid the way I've made it (without censoring) and can I compare both survival curves like this (for example with survdiff())?
c) in a regression situation (when adjusting for multiple variables) would I then revert to using a Cox-proportional hazards model on this type of data?
d) OR is this a case where you could (should?) instead use an accelerated failure time model, because
AFT model assumes that the effect of a covariate is to accelerate or decelerate the life course of a disease by some constant
And it is very likely that being tested with this bacteria will decelerate the "life course" (e.g. length of stay).
(I've never used an AFT and haven't come across it too often in medical literature, but maybe that's just my ignorance).
Thanks for any thoughts.
sample data
structure(list(Length_of_stay = c(29L, 10L, 41L, 23L, 20L, 3L,
14L, 13L, 41L, 19L, 11L, 25L, 46L, 34L, 59L, 2L, 84L, 26L, 10L,
10L, 39L, 62L, 46L, 34L, 55L, 11L, 27L, 15L, 15L, 47L, 32L, 26L,
26L, 34L, 23L, 22L, 8L, 6L, 103L, 42L, 77L, 29L, 49L, 17L, 30L,
81L, 15L, 8L, 10L, 20L, 13L, 91L, 18L, 33L, 34L, 59L, 11L, 38L,
16L, 8L, 17L, 14L, 5L, 45L, 9L, 26L, 56L, 29L, 11L, 18L, 25L,
11L, 10L, 9L, 16L, 40L, 19L, 19L, 33L, 11L, 11L, 26L, 10L, 12L,
73L, 14L, 15L, 11L, 9L, 47L, 5L, 16L, 217L, 10L, 20L, 152L, 2L,
25L, 36L, 14L, 9L, 10L, 6L, 36L, 9L, 15L, 4L, 5L, 8L, 13L, 8L,
26L, 27L, 82L, 8L, 14L, 33L, 63L, 79L, 11L, 52L, 12L, 35L, 120L,
36L, 20L, 42L, 13L, 9L, 32L, 17L, 33L, 14L, 26L, 35L, 17L, 74L,
12L, 40L, 23L, 88L, 62L, 20L, 8L, 32L, 26L, 12L, 54L, 34L, 27L,
26L, 24L, 38L, 15L, 151L, 57L, 5L, 27L, 18L, 12L, 18L, 6L, 5L,
50L, 19L, 27L, 16L, 15L, 27L, 102L, 15L, 59L, 26L, 23L, 46L,
39L, 15L, 22L, 14L, 90L, 49L, 25L, 28L, 8L, 50L, 25L, 16L, 120L,
10L, 17L, 42L, 43L, 6L, 48L, 11L, 26L, 44L, 41L, 48L, 155L, 61L,
42L, 150L, 31L, 71L, 95L, 14L, 15L, 9L), test = structure(c(1L,
1L, 2L, 1L, 1L, 1L, 1L, 1L, 2L, 1L, 1L, 1L, 1L, 1L, 2L, 1L, 2L,
1L, 1L, 1L, 1L, 1L, 2L, 1L, 2L, 1L, 1L, 1L, 1L, 1L, 1L, 1L, 1L,
1L, 1L, 1L, 1L, 1L, 2L, 1L, 1L, 2L, 2L, 1L, 2L, 2L, 1L, 2L, 1L,
1L, 1L, 2L, 1L, 1L, 1L, 1L, 1L, 1L, 1L, 1L, 1L, 1L, 1L, 2L, 1L,
2L, 1L, 2L, 2L, 1L, 1L, 1L, 1L, 1L, 1L, 1L, 1L, 1L, 1L, 1L, 1L,
1L, 1L, 1L, 2L, 1L, 1L, 1L, 1L, 1L, 1L, 1L, 2L, 1L, 1L, 2L, 1L,
2L, 1L, 1L, 1L, 1L, 2L, 2L, 1L, 1L, 1L, 1L, 1L, 1L, 2L, 1L, 2L,
2L, 1L, 1L, 1L, 2L, 2L, 1L, 2L, 1L, 2L, 2L, 2L, 1L, 1L, 1L, 1L,
1L, 1L, 1L, 1L, 2L, 1L, 1L, 2L, 1L, 2L, 1L, 2L, 2L, 1L, 1L, 2L,
2L, 1L, 2L, 2L, 1L, 2L, 1L, 2L, 1L, 2L, 1L, 1L, 1L, 1L, 1L, 1L,
1L, 1L, 2L, 2L, 2L, 1L, 2L, 2L, 2L, 1L, 2L, 2L, 1L, 2L, 2L, 1L,
1L, 1L, 2L, 2L, 2L, 1L, 1L, 1L, 1L, 1L, 2L, 1L, 1L, 2L, 2L, 1L,
1L, 2L, 1L, 2L, 2L, 2L, 2L, 2L, 2L, 2L, 2L, 2L, 2L, 1L, 1L, 1L
), .Label = c("No", "Yes"), class = "factor")), class = c("tbl_df",
"tbl", "data.frame"), row.names = c(NA, -209L), .Names = c("Length_of_stay",
"test"))