In the following picture, the boxplots represent a performance metric (the closer to 1, the better) recorded for 50 runs of cross-validation, and the black filled circles are the training values of the models (performance of the models on the full data set).
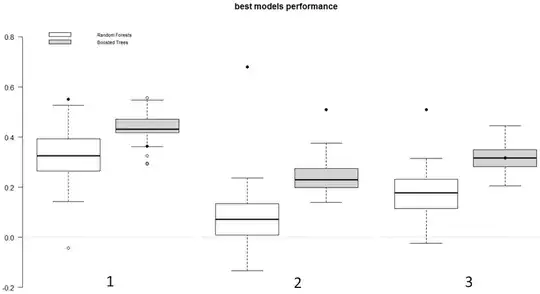
It seems to me that the "white model" (Random Forests) strongly overfits in case #2 (and possibly in case #3)? Simply by comparing the training and testing values, can I reasonably infer that?
On a separate note, it seems that the "grey model" (Boosted Trees) has a slight tendency to underfit (in light of cases #1 and #3)? If yes, does it mean that this model is not optimal - and that, therefore, my best model selection procedure is also not optimal? .
PS: in case it matters, the models are used for multiclass classification, the performance metric is the Rank Probability Skill Score (RPSS), and each run of cross-validation randomly leaves 5% of the observations out (~150 observations).