I am trying to find a correlation between a given data set containing redshifts and turnover frequencies (I have a list of 320 galaxies, and the redshift and turnover frequency (a turnover frequency is the frequency of the peak in the radio spectrum) is given for each (so have 320 data points)), but a third of the turnover frequency measurements are upper limits. I am looking at using the lifelines package (depends on pandas) to analyse this, but so far I have only seen tutorials that consider only one data set (eg. age at death).
So far I have only been able to include the uncensored measurements in fitting a trendline.
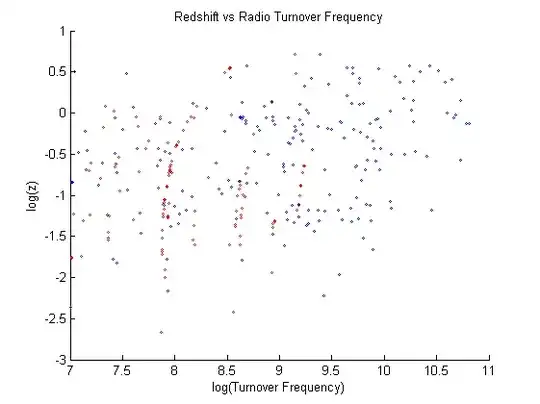
The red points are upper limits. As you can see, the correlation is extremely weak.
Can lifelines be used to find relationships between two variables like as described above?
If so, could I use the KaplanMeierEstimator function?
If not, does anyone have a suggestion for a survival analysis package for python that can analyse my data? (I know of Rpy2, but have had trouble installing)