4

Let's say I have blood samples of whiteblood cells ($x$) and viruses ($v$). Space has been discretized in $LL$ spaces. They have a $p_v$ probability of interacting when found in the same space. I want to know at each sample how many $x$ and $v$ are interacting.

Here is a naive implementation of the model:

LL <- 1e4
nx <- 5000
nv <- 500
x <- c(rep(1,nx),rep(0, LL-nx))
v <- c(rep(1,nv),rep(0, LL-nv))
pv <- 0.8
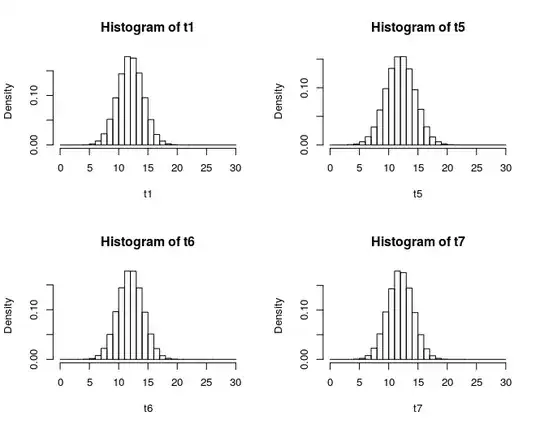
t1 <- sapply(1:1e4, function(z) sum(sample(v)==1 & sample(x)==1 & runif(LL)<pv))

t1 represents how many times $x$ and $v$ interacted, in each of 1e4 samples.

I want to model this using a probability distribution, in order to make it more efficient. I think we can see this problem as a Binomial (and later maybe approximate with a Poisson), but I am not sure what arguments to pass to the Binomial. I can think of:

  • at each space, there is a probability they are interacting, depending on their concentrations
  • for each $x$, the probability is given by the concentration of $v$
  • for each $v$, the probability is given by the concentration of $x$

In the first two cases, I have to limit the Binomial result to $nv$, which is the lowest value of molecules, and thus no more interactions than those are possible.

limit <- function(z)
    sapply(z, function(z) min(z,nx,nv))
t3 <- limit(rbinom(1e4, LL, pv*nx*nv/(LL*LL)))
t4 <- limit(rbinom(1e4, max(nx,nv), pv*min(nx,nv)/LL))
t5 <- rbinom(1e4, min(nx,nv), pv*max(nx,nv)/LL)

The histograms:

par(mfrow=c(2,3))
b <- seq(130, 270, 10)
hist(t1,b,FALSE)
hist(t3,b,FALSE)
hist(t4,b,FALSE)
hist(t5,b,FALSE)

histograms

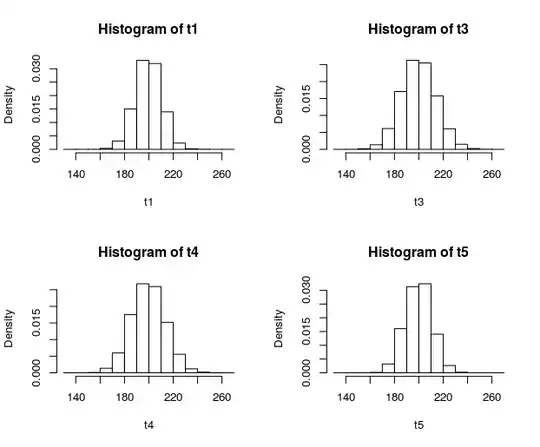
print(sprintf("mean: %.3f x %.3f x %.3f x %.3f x %.3f",mean(t1),mean(t3),mean(t4),mean(t5)))
print(sprintf("sd: %.3f x %.3f x %.3f x %.3f x %.3f",sd(t1),sd(t3),sd(t4),sd(t5)))

Output:

[1] "mean: 200.036 x 200.281 x 199.991 x 200.108"
[1] "sd: 10.660 x 14.076 x 13.817 x 10.841"

The result suggests the latter maybe. Would love to have some feedback on this though. Thank you so much !

1 Answers1

1

So, my question was whether the problem I presented could be modeled using a popular probability distribution.

The 3rd distribution I proposed seemed to work pretty well: $X\sim\mathcal{B}(\min(n_x,n_v),p_v\max(n_x,n_v)/LL)$. But it was still a little off. Besides, I was puzzled as to the differences between the distributions I proposed

@whuber (in a comment below) suggested this was so because I was constraining the distribution to $n_v$, but not to $n_x$; in other words, I was sampling $n_x$ independently of $LL$.

Taking that into account, this code seems like the correct distribution:

t6 <- sapply(1:nsim, function(z) {
    n <- 0
    for(vi in 1:nv)
        if(runif(1) < pv*(nx-n)/(LL-vi+1))
            n <- n+1
    n
})

Edit: Based on a 2nd suggestion by @whuber, I think we can use the hypergeometric distribution for this, $\mathcal{H}(nx,LL-nx,nv)$ ! (The idea being that I, and the other viruses, are choosing balls in a urn: they can either have a WTC there or not.)

t7 <- rhyper(nsim, nx, LL-nx, nv)

Comparing histograms:

histograms

Comparing means and standard deviations:

print(sprintf("mean: %.3f x %.3f x %.3f x %.3f x %.3f x %.3f",mean(t1),mean(t3),mean(t4),mean(t5),mean(t6),mean(t7)))
print(sprintf("sd: %.3f x %.3f x %.3f x %.3f x %.3f x %.3f",sd(t1),sd(t3),sd(t4),sd(t5),sd(t6),sd(t7)))
[1] "mean: 12.495 x 12.495 x 12.520 x 12.497 x 12.500 x 12.484"
[1] "sd: 2.178 x 3.303 x 3.064 x 2.496 x 2.174 x 2.182"
  • 1
    Your approximation would be correct if each of the $LL$ places was independently occupied with a WBC with probability $n_x/LL.$ It errs slightly because the constraint that there be *exactly* $n_x$ WBCs will reduce the standard deviation. – whuber Apr 20 '15 at 21:41
  • @whuber, eureka! I have changed my own answer to incorporate your thought. Wondering ... do you know if I can use some sort of Binomial-based distribution, where probability decreases with time? (I will be happy to give the answer to you, if you can do that :D) – Ricardo Magalhães Cruz Apr 21 '15 at 18:25
  • Could you explain the role of time in this problem? This appears to be the first mention of it. – whuber Apr 21 '15 at 19:29
  • I meant with "trials" ! I am rewritting a simulation using stochastic processes, which someone wrote in a less mathematical fashion. I have several situations where, for each trial, the probability of the next event decreases. The Binomial is the best approximation I have. I wonder if there is some Binomial-like distribution where probabilities decrease following a certain function ... – Ricardo Magalhães Cruz Apr 21 '15 at 21:08
  • You have reminded me of an answer I wrote to a question about (generalized) [hypergeometric distributions](http://stats.stackexchange.com/questions/90605). Although they might not be what you are looking for, perhaps they indicate the kinds of modeling options available to you. It would be better, though, to begin with stating exactly how the probabilities are supposed to decrease and going on from there. – whuber Apr 21 '15 at 21:34
  • @whuber, a simpler problem than the one I presented here is: I have found that I can replicate the carrying capacity of WBCs in their non-mathematical model, using the following probability: $p=1-n_x/LL$. (I add the new WBC is that probability is successful, and thus $n_x$ gets incremented by 1, or not.) To add $m_x$ cells, I can do it using a cycle, where $n_x$ is incremented by one everytime WBC was successfully added. I can approximate it this using, for instance, $\mathcal{B}(m_x,p)$, but of course it is only an approximate. I wonder if there is an exact distribution to solve this ... – Ricardo Magalhães Cruz Apr 22 '15 at 15:11
  • @whuber, with regard to the example I mentioned, modelling carrying capacity, maybe I can reproduce their non-mathematical simulation by using $\mathcal{H}(LL-n_x,n_x,m_x)$. I am effectively creating two "decks" -- the space is either empty or full -- and I am counting how many empty spaces from the empty "deck" I can "draw". Thank you :D Maybe I can apply a similar thinking to find a distribution for this. I have to study this more carefully ... – Ricardo Magalhães Cruz Apr 22 '15 at 15:58
  • hey @whuber, check out this updated self-answer of mine. I think I managed to use the hypergeometric distribution for this ... check it out ... would love to hear from you :D – Ricardo Magalhães Cruz Apr 23 '15 at 07:35