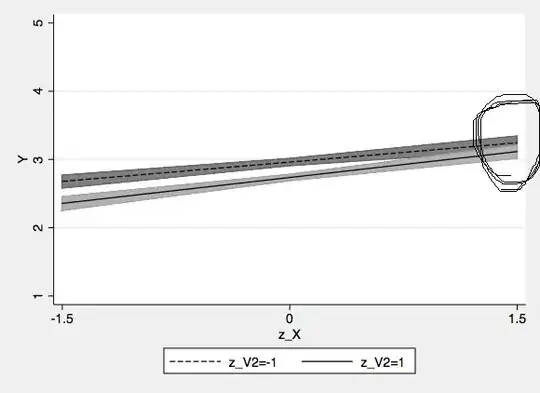
I'm exploring a significant two-way interaction in a multi-level random-effects regression. The graph (below) appears to show the interaction is driven by differences at low X, and that at high X the moderator (V2) doesn't matter. Is there a reason why I get highly significant contrasts at high X when the confidence intervals appear to overlap?
Interaction graph (circles show where the reported contrast is being conducted):
Contrast code in Stata: http://www.statalist.org/forums/forum/general-stata-discussion/general/1211045-simple-effects-after-regression
Contrast test at high X (circled on the graph):
      Y   |      Coef.   Std. Err.      z    P>|z|     [95% Conf. Interval]
----------+-------------------------------------------------------------------
z_X = 1.5 |  -.1288761   .0471769    -2.73   0.006    -.2213412   -.0364111
------------------------------------------------------------------------------
That's surprising. Is this something to do with multi-level (nested/panel) data? I'm not very familiar with inferential stats using multiple levels simultaneously. I would have expected that if the 95% confidence intervals overlap, as they clearly do for z_X = 1.5, that the contrast there would be not significant or close to that. Thanks for reading.
The following are relevant posts, but I sadly admit I did not follow the explanations: Relation between confidence interval and testing statistical hypothesis for t-test
Large overlap between confidence intervals, although z test for difference was significant
I'm also new around here, so please let me know if I could improve how I asked this question.