Clearly, this question is asking for tests of linearity. Tests for linearity, including cumulative sum control chart CUSUM, are reviewed here. These include tests called
Frequency Domain tests by Subba Rao and Gabr, and Hinnich
Time series tests squares of time series data, the Portmanteau test and CUSUM,
  the Test for additivity, the Score Test, the Bootstrapped COX test,
  and the Neyman-Pearson test
Linearity tests against specific alternatives
Which test should be used to test for non-linearity is itself subject to testing. The first, most common test, and one that applies to everything, is to plot residuals, i.e., the difference between the model and the data points, and examine them. If these are flat (e.g., not u-, n-, w- or m-shaped), then linearity is not ruled out. Beyond plotting, which linearity test is appropriate depends on the circumstances. For example, one problem with ordinary least squares is that sometimes the residuals may trend linearly. This is because least squares in $y$ minimizes the error in estimating $y$ and is sometimes not a best functional relationship between $x$ and $y$. Thus, a second order test of residuals is to fit those residuals with an ordinary least squares line to see if the slope is zero or not. Zero slope of residuals will occur when, for example, the $x$-values are equidistant as they would be in some time series, and there are other conditions as well that result in an absence of slope bias of residuals. If the slope is zero (to within machine precision, this is not subtle), then the conditions are met to use a CUSUM linearity test. If the slope of residuals is not zero, the problem may be bivariate, and certain measures, e.g., CUSUM or R$^2$, would be misleading. To overcome this, bivariate regression, e.g., a Deming regression or, in some circumstances a Passing-Bablok regression, can identify a best linear functional relationship without residual linear bias. In those bivariate cases, the CUSUM algorithm can be used to test for linearity.
There are lots of tests, not just CUSUM, not just adjusted-R$^2$. Regarding adjusted-R$^2$, this does not test specifically for linearity/non-linearity. For example, without testing for collinearity, and a separate linearity test of the highly collinear parameters, adjusted-R$^2$ alone would miss the source of the non-linearity. Adjusted-R$^2$ would fall under linearity tests against specific alternatives in the classification above, precisely because it does not test for non-linearity but for all sources of error including noise. To convert R$^2$ to measure non-linearity, or more precisely modeling error, the noise error would have to be modeled and removed. That was done in this paper, see the Appendix Section.
If more information is desired, please say so. Bivariate regression references below.
A New Biometrical Procedure for Testing the Equality of Measurements from Two Different Analytical Methods
H. Passing, W. Bablok, J. Clin. Chem. Biochem. Vol 21 No. 11 1983; 709-720
Comparison of Several Regression Procedures for Method Comparison Studies and Determination of Sample Sizes
H. Passing, W. Bablok, J. Clin. Chem. Biochem. Vol 22 No. 6 1984; 431-445
A General Regression Procedure for Method Transformation
H. Passing, W. Bablok, J. Clin. Chem. Biochem. Vol 26 No. 11 1988; 783-790
Evaluation of Regression Procedures for Method Comparison Studies
Kristian Linnet, Clin.Chem. Vol. 39 No. 3 1993; 424-432
Incorrect Least-Squares Regression Coefficients in Method-Comparison Analysis
P. Joanne Cornbleet, Nathan Gochman, Clin Chem. Vol 25 No. 13 1979; 432-437
Estimation of the Linear Relationship Between the Measurements of Two Methods with Proportional Errors
Kristian Linnet, Statistics in Medicine Vol 9 1990; 1463-1473
Performance of Deming regression analysis in case of misspecified analytical error ratio in method comparison studies
Kristian Linnet,Clin Chem. Vol 44 No. 5 1998; 1024-1031
Necessary Sample Size for Method Comparison Studies Based on Regression Analysis
Kristian Linnet, Clin Chem. Vol 45 No. 6 1999; 882-894
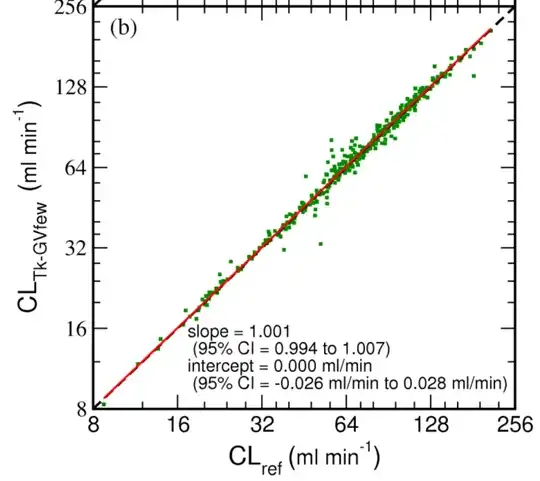
One image from a methods comparison study for @Sycorax showing that in certain contexts good agreement between methods can be achieved. There are many such contexts.
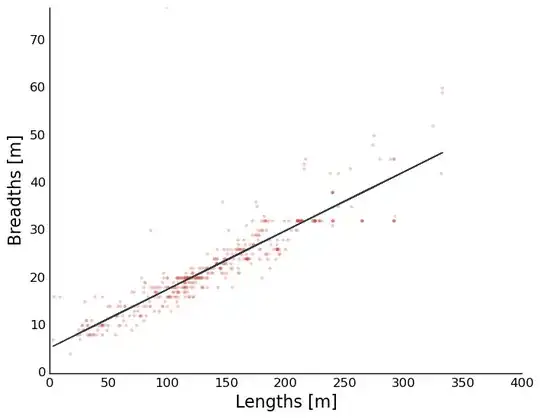
Finally, the plot shown in the question appears (from personal experience) to have residual non-zero slope. This is likely a bivariate problem. Test the residuals' slope before choosing a test for linearity. P.S. Residual slope testing is done nonparmaterically, i.e., using rank ordered residuals: 1,2,3,4,... not parametrically (x1,x2,x3,x4,...).