1

I hope somebody in here can help me: I'm looking for some pointers as to how to distinguish random fluctuation from actual changes in trends, e.g.:

  • In a time series with measures taken at monthly (daily) intervals, for how many months (days) does the change have to be consistent (e.g. going from decreasing to increasing) before one can say that it is an actual change in trend and not just a random fluctuation?

  • How large (percentage-wise or in comparison with the variation) does the change have to be in order to be a real change and not just a random fluctuation?

Is there any any rules of thumb or hard rules on this?

Thanks!

EDIT: Example: If I have a time series with 60 observations, and the trend change (from decreasing to increasing, say) at observation 30, when will I be able to detect that it is a real change in the trend and not a random fluctuation? At observation 31? 32? 33? Something else?

r1 <- seq(1,30, by = 1)
r2 <- 1/r1
r3 <- sort(r2)
ex <- append(r2,r3)

   ex
[1] 1.00000000 0.50000000 0.33333333 0.25000000 0.20000000 0.16666667 0.14285714 0.12500000 0.11111111 0.10000000 0.09090909 0.08333333 0.07692308 0.07142857 0.06666667 0.06250000 0.05882353 0.05555556 0.05263158 0.05000000 0.04761905 0.04545455 0.04347826 0.04166667 0.04000000
[26] 0.03846154 0.03703704 0.03571429 0.03448276 0.03333333 0.03333333 0.03448276 0.03571429 0.03703704 0.03846154 0.04000000 0.04166667 0.04347826 0.04545455 0.04761905 0.05000000 0.05263158 0.05555556 0.05882353 0.06250000 0.06666667 0.07142857 0.07692308 0.08333333 0.09090909
[51] 0.10000000 0.11111111 0.12500000 0.14285714 0.16666667 0.20000000 0.25000000 0.33333333 0.50000000 1.00000000
SiKiHe
  • 455
  • 6
  • 14
  • 1
    Do you have a data example? The following link may help if you use R: http://www.statmethods.net/advstats/timeseries.html – Ruthger Righart Apr 14 '15 at 11:53
  • I am using R :) – SiKiHe Apr 14 '15 at 12:41
  • 1
    You may be interested in [this post](http://stats.stackexchange.com/questions/116363/how-to-characterize-abrupt-change). – javlacalle Apr 14 '15 at 21:09
  • @javlacalle: I don't think this question is about change detection and analysis in time series, but rather about trend analysis (please see my answer and comments). – Aleksandr Blekh Apr 14 '15 at 22:51
  • The question is exactly about change detection - hence my point that your answer below doesn't answer the question I asked! – SiKiHe Apr 15 '15 at 06:50
  • @SiKiHe: My answer indeed answers the original question. You wrote: "I'm looking for some pointers as to how to distinguish random fluctuation from actual changes in trends". This is exactly what TS decomposition does and my answer reflects that. If you want to ask about TS change detection, then you need to post a separate question for that. – Aleksandr Blekh Apr 15 '15 at 07:06
  • Read the edit. Since the other people who have posted answers actually answer the question I asked, I think it is a matter of misunderstanding, and I think this discussion is completely off the point of finding out how to detect trend changes, so I'm not going to keep discussing whether you have answered my question or not. – SiKiHe Apr 15 '15 at 07:11

3 Answers3

2

Expanding on @Aleksendr Blekh's answer. You can use the below code for decomposing trend, using the decompose function in R:

births <- scan("http://robjhyndman.com/tsdldata/data/nybirths.dat")
birthstimeseries <- ts(births, frequency=12, start=c(1946,1))
if(!require("TTR")) { install.packages("TTR");  require("TTR") }
birthstimeseriescomponents <- decompose(birthstimeseries)
birthstimeseriescomponents$seasonal # the seasonal component
birthstimeseriescomponents$trend # the trend component
birthstimeseriescomponents$random # random (irregular / remainder) component
# plot the seasonality, trend and random (epsilon) components
plot(birthstimeseriescomponents)

For changes in trends, relevant reading: Hidden Markov Models, Change Point Analysis.

This post may also be helpful to find fluctuations from the underlying trend. The approach here is fitting a polynomial instead of time series decomposition and reporting points that fall outside the confidence intervals.

Zhubarb
  • 7,753
  • 2
  • 28
  • 44
2

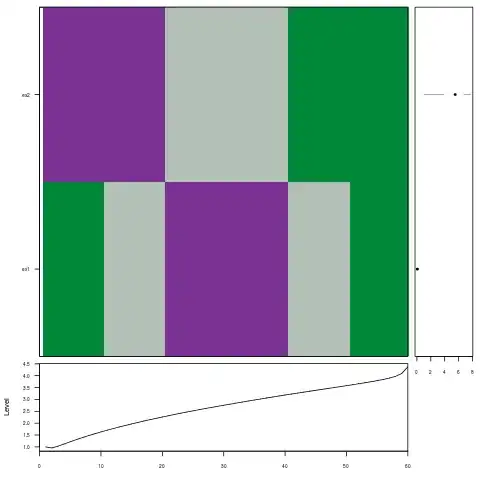
The multivariate time series tool mvtsplot may be useful to explore several time-series. This plot provides quick insight if values are high or low, before using other stats for examining trends and noise.

By default, the function uses three colors to divide the data in low, medium and high categories (purple=low values, grey=medium values, green=high values). This number can be changed using levels (for quartiles, use levels=4).

Expanding on your data I add a second example

r1 <- seq(1,30, by = 1)
r2 <- 1/r1
r3 <- sort(r2)
ex1 <- append(r2,r3)

ex2 <- c(1:60)^0.5

Plot to compare the series

plot(ex1, type="l", col="red", ylim=c(0,9))
lines(ex2, col="blue")

Plot using mvtsplot

library(mvtsplot)
dat<-as.matrix(cbind(ex1, ex2))
mvtsplot(dat, level=3, margin=TRUE)

enter image description here

MVTSPLOT

enter image description here

purple=low values grey=medium values green=high values.

Ruthger Righart
  • 510
  • 1
  • 6
  • 11
1

Basically, you have to perform trend analysis, which is time series exploratory technique, based on ARMA family of models, of which ARIMA is most likely the most popular one. However, for your purposes, I think that it might be enough to just perform time series decomposition, where, along with seasonality and cyclical pattern, trend is one of the main components. More details on time series decomposition as well as some examples can be found here. In regard to some existing rules of thumb for time series' minimum sample size, Prof. Rob J. Hyndman dismisses such guidelines as "mis­lead­ing and unsub­stan­ti­ated in the­ory or prac­tice" in this relevant blog post.

Aleksandr Blekh
  • 7,867
  • 2
  • 27
  • 93
  • This doesn't really answer my question, I'm afraid. I don't want to know the minimum number of observations I can fit a time series to, I want to know the minimum number of observations needed to distinguish a change in trends from a random fluctuation. – SiKiHe Apr 14 '15 at 12:30
  • @SiKiHe: I think that it does. The whole point of _time series decomposition_ is to extract _systematic components_, i.e. _trend_, and ignore _noise (random fluctuations)_. Citing from StatSoft textbook: "As in most other analyses, in time series analysis it is assumed that the data consist of a systematic pattern (usually a set of identifiable components) and random noise (error) which usually makes the pattern difficult to identify. Most time series analysis techniques involve some form of filtering out noise in order to make the pattern more salient.". (to be continued) – Aleksandr Blekh Apr 14 '15 at 22:45
  • @SiKiHe: (cont'd) Since you have to fit a model for time series decomposition to extract trend, my point about lack of valid rules of thumb for minimum sample size (# of observations), supported by referenced Prof. Rob J. Hyndman's blog post, still holds. – Aleksandr Blekh Apr 14 '15 at 22:48
  • STL-decomposition will do the same trick. Short of reading the R source code for `decompose` to extract the information on how they calculate the trend, the answer is useless. – SiKiHe Apr 15 '15 at 06:49