23

I know that if the median and mean are approximately equal then this means there is a symmetric distribution but in this particular case I'm not certain. The mean and median are quite close (only 0.487m/gall difference) which would lead me to say there is a symmetric distribution but looking at the boxplot, it looks like it's slightly positively skewed (the median is closer to Q1 than Q3 as confirmed by the values).

(I'm using Minitab if you have any specific advice for this piece of software.)

amoeba
  • 93,463
  • 28
  • 275
  • 317
user72943
  • 253
  • 1
  • 3
  • 7
  • Orthogonal comment on a detail: what units are m/gall? That looks like metres per gallon, and I'm intrigued. – Nick Cox Apr 07 '15 at 15:10
  • It's a serious limitation here that box plots do not usually show means at all! – Nick Cox Apr 07 '15 at 15:11
  • What it the standard deviation of your data? If the value of 0.487m/gall is far smaller than your standard deviation then probably you have reasons to believe you distribution can be symmetric. If that value is much greater than your standard deviation (or MAD or whatever deviation measure you look at) probably examining the symmetry of distribution further is a loss of time. – usεr11852 Apr 08 '15 at 00:06
  • 1
    $-70,-63,-56,-49,-42,-35,-28,-21,-14,-7,0,1,4,9,16,25,36,49,64,81,100$ is deliberately not symmetric (uniform in the lower half but not in the upper half) and a box plot would put the median (equal to the mean) nearer the upper quartile than the lower quartile but also nearer the minimum than the maximum. – Henry Apr 08 '15 at 17:46
  • @NickCox it could also be [milligal](https://en.wikipedia.org/wiki/Gal_(unit)) with a typo. That would be almost 500 $\mu$gal! Or less than $10^{-4}$ g's. (Of course as noted above, without some dispersion scale such as MAD, no way to know what could be "significant".) – GeoMatt22 Sep 13 '16 at 01:23
  • @GeoMatt2 Could be; if I had to bet I would bet on m meaning miles and thus miles per gallon. – Nick Cox Sep 13 '16 at 06:04

4 Answers4

29

No doubt you have been told otherwise, but mean $=$ median does not imply symmetry.

There's a measure of skewness based on mean minus median (the second Pearson skewness), but it can be 0 when the distribution is not symmetric (like any of the common skewness measures).

Similarly, the relationship between mean and median doesn't necessarily imply a similar relationship between the midhinge ($(Q_1+Q_3)/2$) and median. They can suggest opposite skewness, or one may equal the median while the other doesn't.

One way to investigate symmetry is via a symmetry plot*.

If $Y_{(1)}, Y_{(2)}, ..., Y_{(n)}$ are the ordered observations from smallest to largest (the order statistics), and $M$ is the median, then a symmetry plot plots $Y_{(n)}-M$ vs $M-Y_{(1)}$, $Y_{(n-1)}-M$ vs $M-Y_{(2)}$ , ... and so on.

* Minitab can do those. Indeed I raise this plot as a possibility because I've seen them done in Minitab.

Here are four examples:

$\hspace{6cm} \textbf{Symmetry plots}$
Symmetry plots of above type for samples from four distributions

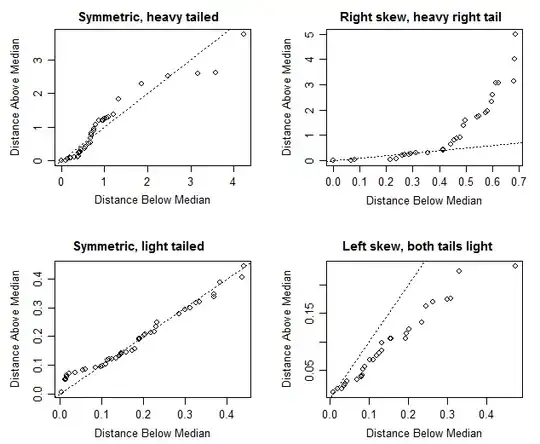
(The actual distributions were (left to right, top row first) - Laplace, Gamma(shape=0.8), beta(2,2) and beta(5,2). The code is Ross Ihaka's, from here)

With heavy-tailed symmetric examples, it's often the case that the most extreme points can be very far from the line; you would pay less attention to the distance from the line of one or two points as you near the top right of the figure.

There are of course, other plots (I mentioned the symmetry plot not from a particular sense of advocacy of that particular one, but because I knew it was already implemented in Minitab). So let's explore some others.

Here's the corresponding skewplots that Nick Cox suggested in comments:

$\hspace{6cm} \textbf{Skewness plots}$
Skewness plots as suggested by Nick Cox in comments

In these plots, a trend up would indicate a typically heavier right tail than left and a trend down would indicate a typically heavier left tail than right, while symmetry would be suggested by a relatively flat (though perhaps fairly noisy) plot.

Nick suggests that this plot is better (specifically "more direct"). I am inclined to agree; the interpretation of the plot seems consequently a little easier, though the information in the corresponding plots are often quite similar (after you subtract the unit slope in the first set, you get something very like the second set).

[Of course, none of these things will tell us that the distribution the data were drawn from is actually symmetric; we get an indication of how near-to-symmetric the sample is, and so to that extent we can judge if the data are reasonably consistent with being drawn from a near-symmetrical population.]

Glen_b
  • 257,508
  • 32
  • 553
  • 939
  • That is so much more helpful compared to the subjective stuff. This did totally answer my question, my problem is solved. – user72943 Apr 07 '15 at 14:49
  • 3
    @user72943 If you're totally satisfied with it, don't forget to come back and select Glen_b's answer. You might want to wait a little while to see if someone submits a better answer, but Glen_b will receive more credit if you accept the answer. – Wayne Apr 07 '15 at 14:53
  • 3
    +1, but a quibble. I find a plot of (upper quantile $+$ lower quantile)/2 versus (upper quantile $-$ lower quantile) more direct than the symmetry plot here. For quantile read order statistic if so desired. The reference situation is a symmetric distribution in which the averages of paired quantiles all equal the median, so a symmetric distribution plots as a straight line. Slight and marked asymmetry are both easy to spot, as is (e.g.) approximate symmetry in the middle and marked exceptions in one or both tails. – Nick Cox Apr 07 '15 at 14:56
  • 6
    +1 In *EDA*, John Tukey simply plots a sequence of midranges. These are the values $(Y_{(n+1-i)} + Y_{(i)})/2$ for a carefully chosen sequence of indexes $i$ (approximating $n/2, n/4, n/8$, and so on). In some ways this plot is better than symmetry plots insofar as it filters out an excess of detail and helps the viewer focus on how symmetry (or lack thereof) changes as one moves out into a tail. It has the added benefit of being immediately and easily computable once an n-letter summary is in hand, which in turn can be read directly off a stem-and-leaf plot. – whuber Apr 07 '15 at 14:58
  • 1
    @whuber and I are talking of the same underlying idea. The difference is between plotting all paired order statistics (not in practice very distracting) or plotting just some. – Nick Cox Apr 07 '15 at 15:01
  • +1 @NickCox Would you be so kind as to provide a good link or reference to a text introducing such plots if you know of one? – Alexis Apr 07 '15 at 17:29
  • 1
    References in http://www.stata-journal.com/sjpdf.html?articlenum=gr0003 and for Stata users in the documentation for `skewplot` (SSC). The idea goes back at least to a suggestion attributed to J.W. Tukey in Wilk, M.B. and Gnanadesikan, R. 1968. Probability plotting methods for the analysis of data. _Biometrika_ 55: 1-17. – Nick Cox Apr 07 '15 at 17:48
  • This is a fine answer, but wouldn't a simple KDE plot be enough *for starters*. If I visually see a KDE (bandwidth selection using your favourite method) being non-symmetric, being obviously multimodal, etc. I won't lose time further. – usεr11852 Apr 08 '15 at 00:11
  • @NickCox I included an implementation of the plot you mention in my answer, for comparison with the symmetry plot; four examples of each are given. – Glen_b Apr 08 '15 at 02:19
  • In *Tukey, John W. (1974), "Mathematics and the Picturing of Data", In International Congress of Mathematicians 1974, Vol. 2, pp. 523-532 ed.: James, Ralph D.*, Tukey describes the skew plot (midsummary-spread plot) Nick suggests, but using the letter values whuber described. – Glen_b Apr 08 '15 at 02:32
  • 1
    Thanks for the comments and extra reference. Letter values are a characteristically brilliant simple idea, but simply they never caught on either for introductory texts or in applications, although that doesn't rule out reminders that they may help. Tukey and @whuber are naturally right in the implication that plotting all the paired quantiles may be more than you need. – Nick Cox Apr 08 '15 at 08:50
  • @Nick I quite like the plot you suggested (though if I was plotting by hand, I would be heavily tempted to do something like the one based on letter values). – Glen_b Apr 08 '15 at 08:53
  • That's true. I miss slide rules sometimes and their enforcement of 3 sig.fig. – Nick Cox Apr 08 '15 at 08:56
  • +1 to both answers. Aside from the already mentioned _visual EDA_ approaches, I ran across [this paper](http://www.mayo.edu/research/documents/biostat-73pdf/doc-10027070), which seems to refer to some existing and introduce some new symmetry measures, which, as I understood, are based on [L-moments](http://en.wikipedia.org/wiki/L-moment). I am curious to hear thoughts on those _analytical_ approaches from people, participating in this discussion. – Aleksandr Blekh Apr 08 '15 at 09:56
  • 1
    L-moments have the signal advantage of being based on a systematic approach to distributions and so offering a family of measures. Their use is fairly routine in hydrology and climatology, and perhaps in some other fields. Many other measures seem very _ad hoc_. For example, looking at octiles or quartiles compared with the median gives some often needed practical robustness, but that's the only real advantage I can see. – Nick Cox Apr 08 '15 at 10:33
  • 1
    I changed my mind on letter values. http://www.stata-journal.com/article.html?article=st0465 is a paper. Subscription or pay access required until Q4 2019 or (assuming limited interest) find my email address and ask for a reprint. – Nick Cox Jan 31 '17 at 11:24
6

The easiest thing is to compute the sample skewness. There's a function in Minitab for that. The symmetrical distributions will have zero skewness. Zero skewness doesn't necessarily mean symmetrical, but in most practical cases it would.

As @NickCox noted, there's more than one definition of skewness. I use the one that's compatible with Excel, but you can use any other.

Aksakal
  • 55,939
  • 5
  • 90
  • 176
  • 2
    I think this needs spelling out. In particular, there is no such thing as "the skewness". There are lots of measures and even the uncommon ones are often as useful or interesting as the common ones (e.g. L-moments). Those tempted to regard standardized third moment as **the** measure (and it's my default, too) should note that for Karl Pearson, and for many other authors well into the 20th century, skewness was most often measured relative to the mode. – Nick Cox Apr 07 '15 at 15:08
  • Any skewness coefficient, apart from lacking much power to detect asymmetries (as you correctly remark), also suffers from being (extremely) non-robust, because it is based on the third sample moment. Also, since symmetry can be violated in many (and interesting) ways, a single numerical characterization of symmetry is a poor substitute for the richer graphical diagnostics described in the exploratory data analysis literature. – whuber Apr 07 '15 at 17:19
1

Center your data around zero by subtracting off the sample mean. Now split your data into two parts, the negative and the positive. Take the absolute value of the negative data points. Now do a two-sample Kolmogorov-Smirnov test by comparing the two partitions to each other. Make your conclusion based on the p-value.

soakley
  • 4,341
  • 3
  • 16
  • 27
0

Put your observations sorted in increasing values in one column, then put them sorted in decreasing values in an other column.
Then compute the correlation coefficient (call it Rm) between these two columns.
Compute the chiral index: CHI=(1+Rm)/2.
CHI takes values in the interval [0..1].
CHI is null IF and ONLY IF your sample is symmetrically distributed.
No need of the third moment.
Theory:
http://petitjeanmichel.free.fr/itoweb.petitjean.skewness.html
http://petitjeanmichel.free.fr/itoweb.petitjean.html
(most papers cited in these two pages are downloadable there in pdf)
Hope it helps, even lately.

Petitjean
  • 29
  • 2
  • Wouldn't the correlation, Rm, necessarily be negative? I don't see how CHI could be 1 unless Rm were 1, but since col1 is sorted increasing & col2 is sorted decreasing, RM <=0, meaning CHI would take values in [0, .5]. Am I missing something? – gung - Reinstate Monica Oct 30 '15 at 15:15
  • Please register &/or merge your accounts (you can find information on how to do this in the **My Account** section of our [help]), then you will be able to edit & comment on your own question. – gung - Reinstate Monica Sep 25 '17 at 15:14
  • Yes Rm cannot be positive and CHI cannot exceed 1/2 for distributions of random variables taking values on the real line. In fact the upper bound 1 comes from the general theory introducing the chiral index. It makes sense for distributions of random variables taking values in a more general space. This theory is out of scope of the present discussion, but it is presented in the two web pages that I previously mentioned. – Petitjean Sep 25 '17 at 15:07