0

I'm using MATLAB R2015a, glmfit function for training and glmval for out of sample evaluation. My input sample and out-of-sample are normalized (MAX-MIN mapping / Using MAX-MIN of training sample set for normalizing out-of-sample data set).

When I'm suing SVM or MLP model there isn't any problem and I have output values for all out-of-samples but when I check Logistic Regression outputs, in some samples I have NAN as output.

enter image description here

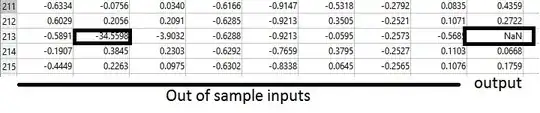
In cases that we have NAN as output, all inputs are negative (or many of them) as we can see in above picture. The above data set is out-of-sample that we used to predict output probabibites after model training phase. Why Logistic Regression returns Nan output for these samples?

PS. In training phase I have this error :

Warning: Iteration limit reached.

Model information :

log Likelihood : -1.2241758
SST = 80
SSR = 40.5388
DFE = 307


Estimated Coefficients:
                   Estimate      SE        tStat        pValue  
                   ________    _______    ________    __________

    (Intercept)      2.0485    0.40146      5.1027    3.3484e-07
    x1              -6.5222     1.4907     -4.3751    1.2136e-05
    x2               1.3972     0.3009      4.6434    3.4269e-06
    x3              -8.7807     2.7749     -3.1644     0.0015542
    x4               96.094     180.41     0.53265       0.59427
    x5             0.042014    0.77166    0.054446       0.95658
    x6             -0.75486    0.72205     -1.0454       0.29582
    x7               1.1678    0.98433      1.1864       0.23548
    x8               1.9328    0.73925      2.6146     0.0089338
    x9             -0.65827     0.2902     -2.2683       0.02331
    x10             -102.83     180.47    -0.56982        0.5688
    x11              1.3374    0.62117      2.1531      0.031311
    x12            -0.43609    0.61412    -0.71011       0.47764


320 observations, 307 error degrees of freedom
Dispersion: 1
Chi^2-statistic vs. constant model: 199, p-value = 5.83e-36
user2991243
  • 3,621
  • 4
  • 22
  • 48
  • 1
    Some more detail would help - a grid of numbers without headers isn't easily interpretable. What's the value of -34.5598 you've put a box round? - a log-odds ratio for one predictor? the overall linear predictor? What's "output"? - the predicted probabilities for the training set? test set? – Scortchi - Reinstate Monica Apr 07 '15 at 11:51
  • @Scortchi .Thank you for your comment. I added some information to the question. – user2991243 Apr 07 '15 at 11:56
  • 1
    Thanks, but there's still very little to go on. Suggestion: check for complete or quasi-complete separation in the training set - the error message suggests the regression algorithm didn't converge on a maximum-likelihood solution. `NaN`s ought then to be `0` or `1`. – Scortchi - Reinstate Monica Apr 07 '15 at 12:06
  • @Scortchi. I'm using 10-fold cross validation in my estimating. So you think my sample can't meet assumption of logistic regression? So we have better results in `SVM` and `MLP` without `NAN` outputs? – user2991243 Apr 07 '15 at 12:08
  • 1
    No, I think the code you're running isn't dealing correctly with very large or very small estimated coefficients. – Scortchi - Reinstate Monica Apr 07 '15 at 12:13
  • @Scortchi. So you think this is a `MATLAB` problem that can't handle these out of range values? Is any link between above error massege and `NAN` outputs? – user2991243 Apr 07 '15 at 12:22
  • For the statistical issue (if I guessed right) see [here](http://stats.stackexchange.com/questions/124616), [here](http://stats.stackexchange.com/questions/45803), & [here](http://stats.stackexchange.com/questions/102695) for what it is & how to check for it, & [here](http://stats.stackexchange.com/questions/11109) for ways to deal with it. For Matlab-specific issues there is a list of support sites [here](http://meta.stats.stackexchange.com/questions/793/). – Scortchi - Reinstate Monica Apr 07 '15 at 12:30
  • Re your edit: if the very large coefficient values are also accompanied by very large standard errors, that would be strongly symptomatic of separation. – Scortchi - Reinstate Monica Apr 07 '15 at 12:41
  • So then, x4 & x10 - plot them against the response to visualize what's going on. Recall that the coefficient estimates are *log*-odds ratios, so very big/small indeed once you exponentiate them. – Scortchi - Reinstate Monica Apr 07 '15 at 16:13

0 Answers0