Exponential Smoothing is a classic technique used in noncausal time series forecasting. As long as you only use it in straightforward forecasting and don't use in-sample smoothed fits as an input to another data mining or statistical algorithm, Briggs' critique does not apply. (Accordingly, I am skeptical about using it "to produce smoothed data for presentation", as Wikipedia says - this may well be misleading, by hiding the smoothed-away variability.)
Here is a textbook introduction to Exponential Smoothing.
And here is a (10-year-old, but still relevant) review article.
EDIT: there seems to be some doubt about the validity of Briggs' critique, possibly somewhat influenced by its packaging. I fully agree that Briggs' tone can be abrasive. However, I'd like to illustrate why I think he has a point.
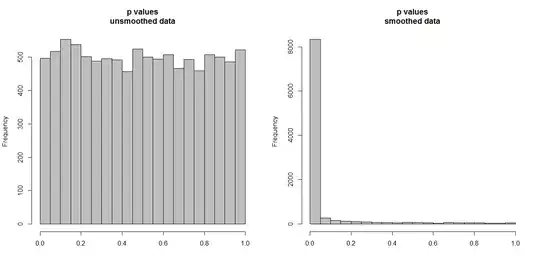
Below, I'm simulating 10,000 pairs of time series, of 100 observations each. All series are white noise, with no correlation whatsoever. So running a standard correlation test should yield p values that are uniformly distributed on [0,1]. As it does (histogram on the left below).
However, suppose we first smooth each series and apply the correlation test to the smoothed data. Something surprising appears: since we have removed a lot of variability from the data, we get p values that are far too small. Our correlation test is heavily biased. So we will be too certain of any association between the original series, which is what Briggs is saying.
The question really hangs on whether we use the smoothed data for forecasting, in which case smoothing is valid, or whether we include it as an input in some analytical algorithm, in which case removing variability will simulate higher certainty in our data than is warranted. This unwarranted certainty in input data carries through to end results and needs to be accounted for, otherwise all inferences will be too certain. (And of course we will also get too small prediction intervals if we use a model based on "inflated certainty" for forecasting.)
n.series <- 1e4
n.time <- 1e2

p.corr <- p.corr.smoothed <- rep(NA,n.series)
set.seed(1)
for ( ii in 1:n.series ) {
    A <- rnorm(n.time)
    B <- rnorm(n.time)
    p.corr[ii] <- cor.test(A,B)$p.value
 p.corr.smoothed[ii] <- cor.test(lowess(A)$y,lowess(B)$y)$p.value
}

par(mfrow=c(1,2))
hist(p.corr,col="grey",xlab="",main="p values\nunsmoothed data")
hist(p.corr.smoothed,col="grey",xlab="",main="p values\nsmoothed data")