6

A binary SVM classifier provides a label $y_c^{(i)}$ for each $i$-th sample provided. This is not assured to be corresponding to its true label $y^{(i)}$, since the classifier could have computed a boundary which misclassifies some samples.

Let's assume that somehow, in case of linear kernel for instance, I am able to find the distance $d$ between the $i$-th sample and the boundary, as shown in the figure.

enter image description here

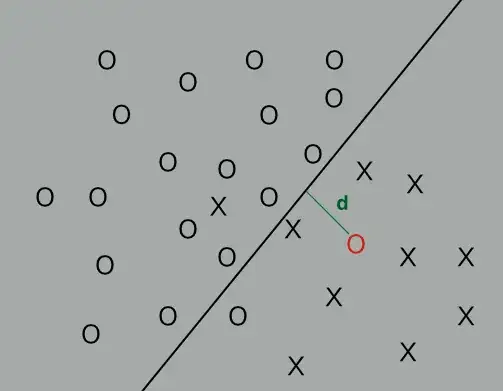
This distance somehow tells me how confident is the classifier in stating that the $i$-th sample belongs to the selected class (either positive or negative).

My problem

When a class $C$ is provided (i.e., either $C='Y'$ or $C='N'$ for binary classification), how to compute the following probability?

$Pr(y^{(i)} = C\quad |\quad y_c^{(i)})$

That is: the probability that $C$ is the true label of the $i$-th sample, given that the classifier gave the opinion $y_c^{(i)}$ on the sample.

My solution (and why it does not work)

I tried to generalize by using the true positive rate of the classifier, that is:

$Pr(y^{(i)} = C\quad |\quad y_c^{(i)}) = \frac{n_{C,y_c^{(i)}}}{\sum_{C'}n_{C',y_c^{(i)}}}$

where $n_{C,y_c^{(i)}}$ is the number of samples of class $C$ that the classifier classified as $y_c^{(i)}$. However, this measure stays as it is for every sample in the set.

What I would like to have

I would like, instead, a measure that depends on the degree of confidence of the classifier, or, somehow, on the distance $d$ computed on the boundary.

Could you please provide some suggestions?

Ferdi
  • 4,882
  • 7
  • 42
  • 62
Eleanore
  • 233
  • 1
  • 10
  • Is there a reason the learning algorithm must be an SVM and not one which naturally outputs probabilities ? You might also want to look at this http://stats.stackexchange.com/questions/76693/machine-learning-to-predict-class-probabilities – image_doctor Mar 28 '15 at 09:01
  • Unfortunately, I am constrained on the type of classifier. – Eleanore Mar 28 '15 at 10:15
  • 1
    http://en.wikipedia.org/wiki/Platt_scaling – Cagdas Ozgenc Mar 31 '15 at 11:16

2 Answers2

6

SVMs do produce a decision function but it does not directly correspond to probability. There is a way in LibSVM (and sklearn which uses that under the hood) to get probabilities using Platt scaling which sounds like what you're looking for. Some more details about how that works are here:

How does sklearn.svm.svc's function predict_proba() work internally?

Converting LinearSVC's decision function to probabilities

Alex I
  • 913
  • 2
  • 9
  • 18
1

What you want sounds akin to a precision-recall (PR) curve. PR curves show precision (TP / (TP + FP)) as a function of recall (TP / (TP + FN)). Every PR point corresponds to a threshold $T$ on the SVM's output $d$ (signed distance to the hyperplane), that is positive if $d \geq T$ and negative otherwise.

As such, you could create a figure depicting precision as a function of decision threshold. The general shape of this figure will be similar to a PR curve, except that it will be stretched horizontally (because not every unique decision value corresponds to a unique recall, the PR curve is more dense horizontally).

It must be noted that, perhaps contrary to intuition, precision is not necessarily highest for the largest decision values ($d$).

Marc Claesen
  • 17,399
  • 1
  • 49
  • 70