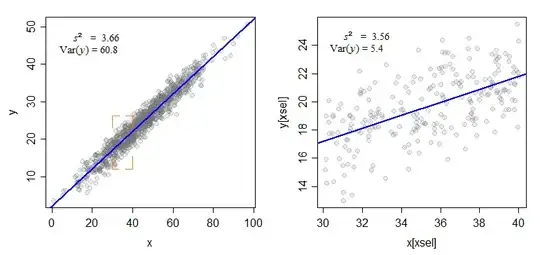
Thinking of a 2D plot of one variable plotted against the other, limiting the range for one variable means only looking at a vertical or horizontal "slice".
So my intuition is that the overall shape of the "cloud" of points will be more vertical or more horizontal, instead of "diagonal". A vertical or horizontal-looking cloud of points has zero correlation. So to me there is indeed an intuition that correlation is likely to decrease.
As a toy example, if your data points are (1,1), (1,20), and (20,20), you have 0.5 correlation, but if you limit the range of the first variable to [0,10] you are left with two points (1,1) and (1,20), and correlation =0. If you limit the second variable to [10,30] then you get two points aligned vertically, and again correlation =0.
