I’d like to learn how best set up a Support Vector Machine for my particular problem (or if indeed there is a more appropriate algorithm).
My goal is to receive a weighting of how well an input set of labeled points on a 2D plane compares or fits with a set of ‘ideal’ sets of labeled 2D points.
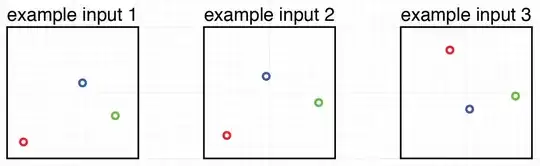
I hope my illustrations make this clearer – the first three boxes labeled A through C, indicate different ideal placements of 3 points, in my illustrations the labelling is managed by colour:
The second graphic gives examples of possible inputs:
If I then pass for instance example input set 1 to the algorithm it will compare that input set with each ideal set, illustrated here:
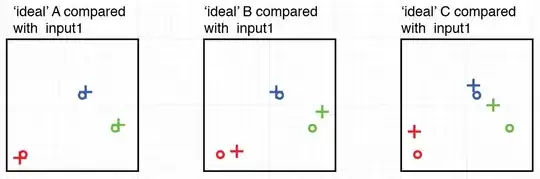
I would suggest that most observers would agree that the example input 1 is most similar to ideal set A, then B, then C.
My problem is to get not only this ordering out of an algorithm, but also ideally a weighting of by how much proportion is the input like A with respect to B and C.
For the example given it might be something like:
A:60%, B:30%, C:10%
Example input 3 might yield something such as:
A:33%, B:32%, C:35% (i.e. different order, and a less 'determined' result)
My end goal is to interpolate between the ideal settings using these weights.
To get the ordering I’m guessing the ‘cost’ involved of fitting the inputs to each set maybe have simply been compared anyway (?) … if so, could this cost be used to find the weighting? or maybe was it non-linear and some kind of transformation needs to happen? (but still obviously, relative comparisons were ok to determine the order).
Am I on track?
Direct question>> What is the right algorithm?
- A series of separated binary SVM classifiers for each ideal state and then a final ordering somehow ? (i.e. what is the metric?)
- A version of an SVM such as multiclass, structured and so on ? (that I still find hard to conceptually grasp as the examples seem so unrelated)
Also another critical component I’m not fully grasping yet is how to define what determines a good fit between any example input set and an ideal set. I was thinking Euclidian distance, and I simply sum the distances? What about outliers? My vector calc needs a brush up, but maybe dot products could nose in there somewhere?
Direct question>> How best to define a metric that describes a fit in this case?
The real case would have 10~20 points per set, and time permitting as many 'ideal' sets of points as possible, lets go with 30 for now. Can I expect to get away with ~2ms per iteration on a reasonable machine? (macbook pro) or does this kind of thing blow up ?
I'm working in C++ with openCV already, would be great to be able to stick with that...