5

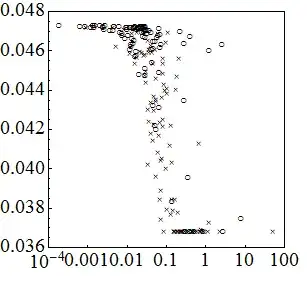
What might be the general form of the equation can be fitted to the below scatter plot? The result should look like an smooth Z

enter image description here

Jeromy Anglim
  • 42,044
  • 23
  • 146
  • 250
K-1
  • 505
  • 3
  • 14
  • 1
    is there any reason why some observations are dots and other crosses? --otherwise, i would say a complementary log-log function (after appropriately re-scaling the vertical axis to get things in 0-1), because of the strong assymetry [you will find it in R in the VGAM library, function cloglog()] – user603 Aug 08 '11 at 10:05
  • the plot includes two time series, one showed by empty disks and the other by crosses. I prefer to keep the vertical axis in linear form and not to change it into logarithmic scale. – K-1 Aug 08 '11 at 10:45
  • The hyperbolic tan (tanh) has a z-shape with bounds -1..1 for y. You might try this using appropriate shift and scaling of the x and y-values – Gottfried Helms Aug 08 '11 at 10:59
  • @Gottfried Helms; sure but that's just still one form of log transform ( http://stats.stackexchange.com/questions/1444/how-should-i-transform-non-negative-data-including-zeros/1630#1630 ) – user603 Aug 08 '11 at 11:03
  • This shape is called [sigmoid](http://en.wikipedia.org/wiki/Sigmoid_function). –  Aug 08 '11 at 11:05
  • @user603: true, but finding the keyword "tanh" helped me much some years ago when I had the same question; "log" has been a much too general (parent) class of transformations - I had just failed to see its possible relation to z-shaped curves/distributions and I remember, it has been an awful fiddling with the pressure of a timeline... – Gottfried Helms Aug 08 '11 at 11:19

1 Answers1

5

then, you might want to try additive models for quantile regressions (some pics/explanation here, and the $\verb+R+$ implementation here). These have various desirable properties:

  1. They resemble classical scatter plot smoother but they are truly non parametric in the sense that they do not assume Gaussian distribution of the residuals (for instance you're data seems somehow bounded, and this type of model would reflect that --a bit in the same sense as in the difference between quantile regression and OLS)
  2. They are robust to outliers on $y|X$, and judging by the plot, you seem to have of those aplenty.
user603
  • 21,225
  • 3
  • 71
  • 135