what does it mean to say data are drawn from a probability distribution P?
-
I believe you will find useful answers among the posts at [What is meant by a “random variable”?](http://stats.stackexchange.com/questions/50). – whuber Feb 25 '15 at 18:49
3 Answers
A random variable is something that takes different values where there is some randomness to the value it can take. A probability distribution assigns a probability to each possible outcome of that random variable. In your case, you are observing data that could've been different. In other words, if you took another sample with the same sample size you'd likely observe something different. Hence what you observe is considered random.
If your random variable is discrete, a probability distribution gives you a rule for the probability of each discrete value your random variable can take. If your random variable is continuous, it gives you a rule for the probability of any range of values your random variable can take.
- 7,414
- 3
- 23
- 39
-
1It might be a good idea to discuss the need for individual data values to be drawn *independently*, which is usually implicitly understood. Also, given the basic nature of the question, consider being more explicit about the connection between a "random variable" and the *data* referenced in the question. – whuber Feb 25 '15 at 18:12
-
I'm not sure I should add something about independence because independence is not necessarily part of the definition of a probability distribution. – TrynnaDoStat Feb 25 '15 at 18:35
-
Although that is correct, the phrase "data are drawn from" (which clearly uses "data" in the plural) indicates the OP is concerned about *multiple* draws, so the issue of independence seems to be implicit in the question. – whuber Feb 25 '15 at 18:41
A probability distribution assigns likelihoods to the values in its domain.
A good way to think about it is a six-sided dice roll. Dice assign probabilities to each of the sides: we have a 1 in 6 chance of seeing each side. However, in practice, we would roll the dice 6 times and are not likely to see all 6 sides.
Instead, the sides that a dice roll gives us are sampled (or, drawn) I.I.D (Independently and identically distributed). This means: each dice roll is independent of the next and each dice roll has the same probability distribution.
Thus, getting the '1' this time does not influence getting the '1' next time.
Eventually, as the number of dice rolls gets increasingly large, the number of times you see each side will be roughly 1/6th of the times you rolled the dice.
You can convince yourself with the following python code:
import matplotlib.pyplot as plt
from numpy.random import randint
X = 10
plt.hist( randint(1,6,X) );
plt.show()
Increase X and watch how the histogram changes.
This analogy applies to the continuous domain as well. In the discrete domain, we say that each discrete item has a certain amount of probability mass. In the continuous domain, ranges of values (1.0-2.0, for example) have probability density. But the analogy is basically the same. The more I.I.D. samples, the more it looks like probability distribution.
- 86
- 2
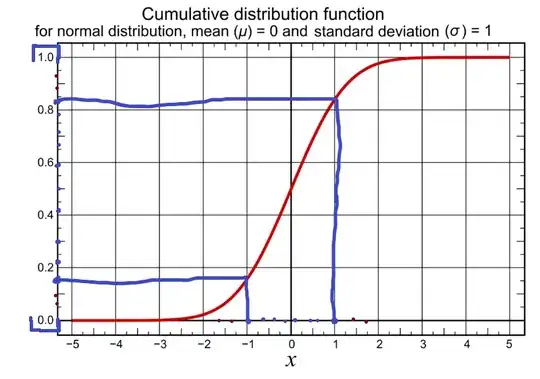
Typically, it means that you make a computer generate pseudorandom numbers between 0 and 1, which is then used as input in the inverse of the cumulative density function (CDF) of the distribution P.
The image below shows the CDF for the normal distribution with mean = 0 and standard deviation = 1:
The computer is generating pseudorandom numbers between 0 and 1 and feeding it through the inverse of the CDF for the normal distribution. You can see how most of the values in the interval [0,1] on the Y-axis get mapped close to the mean, reflecting the characteristics of the normal distribution. E.g. the blue lines show that [~0.15, ~0.85] $\mapsto$ [-1,1], meaning most of the numbers in [0,1] on the Y-axis are ending up clustered around the mean.
IMO, when a paper or a book says these "data are drawn from a probability distribution P", it means "we generated this data so it conforms to our theoretical notions about P".
The alternative is to draw from some real population, i.e. a real sample. Then you don't know the distribution, and have to infer it (fancy guessing).
- 141
- 4
