This is kind of like the analysis of animal tracking data that I have to do in lab. My reflex would be something like this:
First define a linearized track as @Iterator suggested. I do this by defining a spline with somewhere between 3 and 20 control points. You can either fit the spline through all of your data or use something absolute like the physical shape of the taxi runway, or the optimal path that textbook-perfect taxi-ing would produce. Whatever you choose, let's call this the reference path.
Then densely sample that spline - find 100,000 points or so along the spline evenly spaced from beginning to end.
Next, for each point in time, and for each trajectory, determine two things: (x) the identity of point along the reference path that's closest to the XY position of the plane at that point in time, and (y) the euclidean distance between the instantaneous data point and that closest spline point. Plotting y as a function of x gives you a plot of distance between the plane and the reference path, by distance along that path.
If you define your reference path to be the spline through Plane A's trajectory, and make the plot described above for Plane B with respect to that path, you'll have a the distance between the planes as a function of their course along the track, independent of time.
Here's some commented code that does the trick. Works on my computer with the test data here.
% Script to determine distance between 2 paths as a function
% of distance along the first path
%
% Path 1 is used to fit a spline. That spline is densely interpolated
% For a given point along path 2, path1 interpolation points are searched
% for the one with the lowest euclidean distance. The distance to the
% nearest Path1 interpolation point ALONG path 1 is that path 2 points'
% "reference path distance", and the distance between the interpolation
% point and the path 2 point is the "reference path deviance"
%
% Because the points along path 1 aren't monotonically moving from the
% beginning of the path to the end, in order to fit a smooth spline over
% path 1, I have the user click spline control points over path 1. A
% temporary spline is fit to the user's clicked points, and the temporary
% spline is used to break the path 1 data into small groups of data. The
% centroid of each group is taken a control point for building a path 1
% spline.
%% Load data. path1 and path2 are each 2xn [x_data; y_data] %%
load pos_data.mat path1 path2;
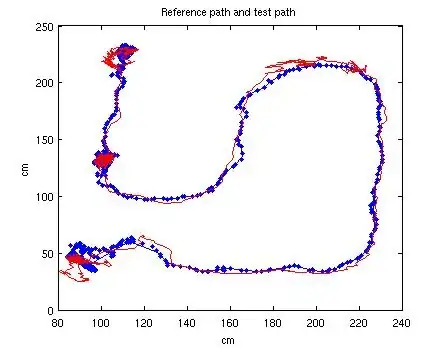
%% Plot raw data & get spline points from user %%
figure; plot(path1(1,:),path1(2,:),'b'); % First path
hold on; plot(path2(1,:),path2(2,:),'r'); % Second path
[spl_x, spl_y] = getpts(); % Mouse-clicks to define spline
user_path = [spl_x'; spl_y']; % Rearrange to same format as path1,2
%% Make spline from user points %%
n_xx = 100; % n_xx interp points for temporary spline
n_x = size(user_path,2); % n_x samples, 2 values each
xx_t = linspace(0,1,n_xx); % the interpolants
x_t = linspace(0,1,n_x); % the parameter for our parametric fn of time
yy_t = spline(x_t,user_path,xx_t); % yy is the points along the path at xx
plot( yy_t(1,:), yy_t(2,:), '.b', 'LineWidth', 4 );
%% Break path1 points into groups by nearest tmp spline interpolant %%
% For each path1 point, find the nearest temp spline point
TRI = delaunay( yy_t(1,:), yy_t(2,:) );
index = dsearch( yy_t(1,:), yy_t(2,:), TRI, path1(1,:), path1(2,:) );
path1_x = zeros(2,n_xx); % make 1 path1 spline control point for each path1 point group
% there are n_xx bins for points in path1. Determine the n_xx centroids
% of the groups of points falling in each of those bins.
for n = 1:n_xx
path1_x(:,n) = [ mean(path1(1, index==n)); ...
mean(path1(2, index==n))];
end
%% Use the centroids just obtained as control points for a 'path1 spline'. %%
n_xx = 1000; % we'll densely sample the path1 spline
n_x = size(path1_x,2); % although we have only 50 control points for path1 spline
xx_p1 = linspace(0, 1, n_xx); % where to interpolate into path1 spline
x_p1 = linspace(0, 1, n_x); % the parameter: distance along temporary spline
yy_p1 = spline(x_p1, path1_x, xx_p1); % spline x&y coordinates along path1
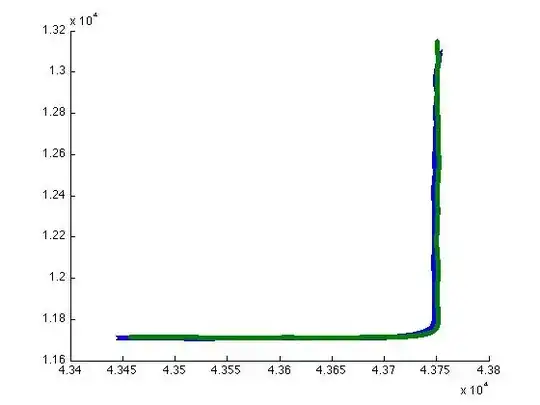
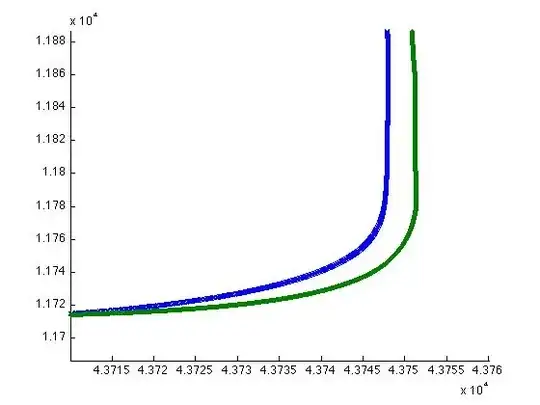
figure; plot( path1(1,:), path1(2,:), '.', 'MarkerSize', 10);
hold on; plot( yy_p1(1,:), yy_p1(2,:), '-');
%% 'Linearize' Path 2 by finding the nearest point along path1 spline for each path2 point. %%
TRI = delaunay( yy_p1(1,:), yy_p1(2,:) );
index = dsearch( yy_p1(1,:), yy_p1(2,:), TRI, path2(1,:), path2(2,:));
path2_dist_along = xx_p1(1,index); % distance along the path1 spline for each path2 point
% is just the interpolation value of the
% path1 spline
% deviance is the euclidian distance between each path2 point and its
% closest path1_spline counterpart
path2_deviance = sqrt((path2(1,:) - yy_p1(1,index)).^2 + (path2(2,:) - yy_p1(2,index)).^2);
figure; plot(path2_dist_along, path2_deviance,'.');
My paths are not nice and even like yours :/ Animal tracking status-quo. So there is a work-around for fitting a spline to that somewhat messy raw data.
And here's the output of the script.
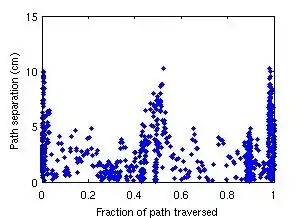
NB: if that were plotted as a line graph instead of a scatterplot, you would see that the points are not in order along the x axis, and the x axis isn't evenly sampled. This could be fixed by some combination of interpolating and smoothing I think, but the solution probably depends on exactly how you want your output to be formatted, so I didn't code it up.
I tried to make the code clear, but please let me know if anything is confusing. Fun question to work on, thanks.